Click images for larger files. Please be patient as the files may be large.
Modeling wetland alteration and watershed
flooding
• Brody, S.D. and Wesley E. Highfield.
Does Planning Work? Testing the Implementation of Local Environmental Planning
in Florida. (2005). Journal of the American Planning Association 71(2): 159-175.
 |
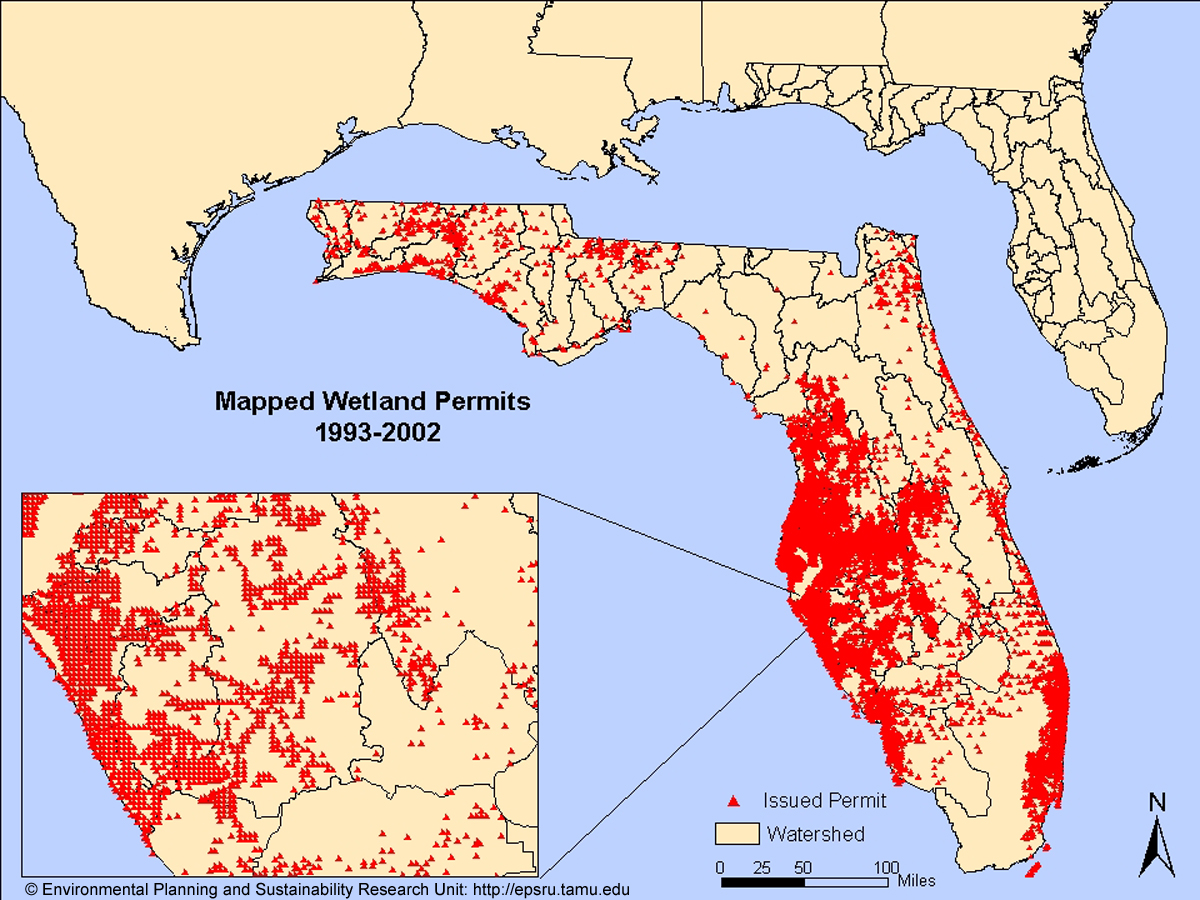
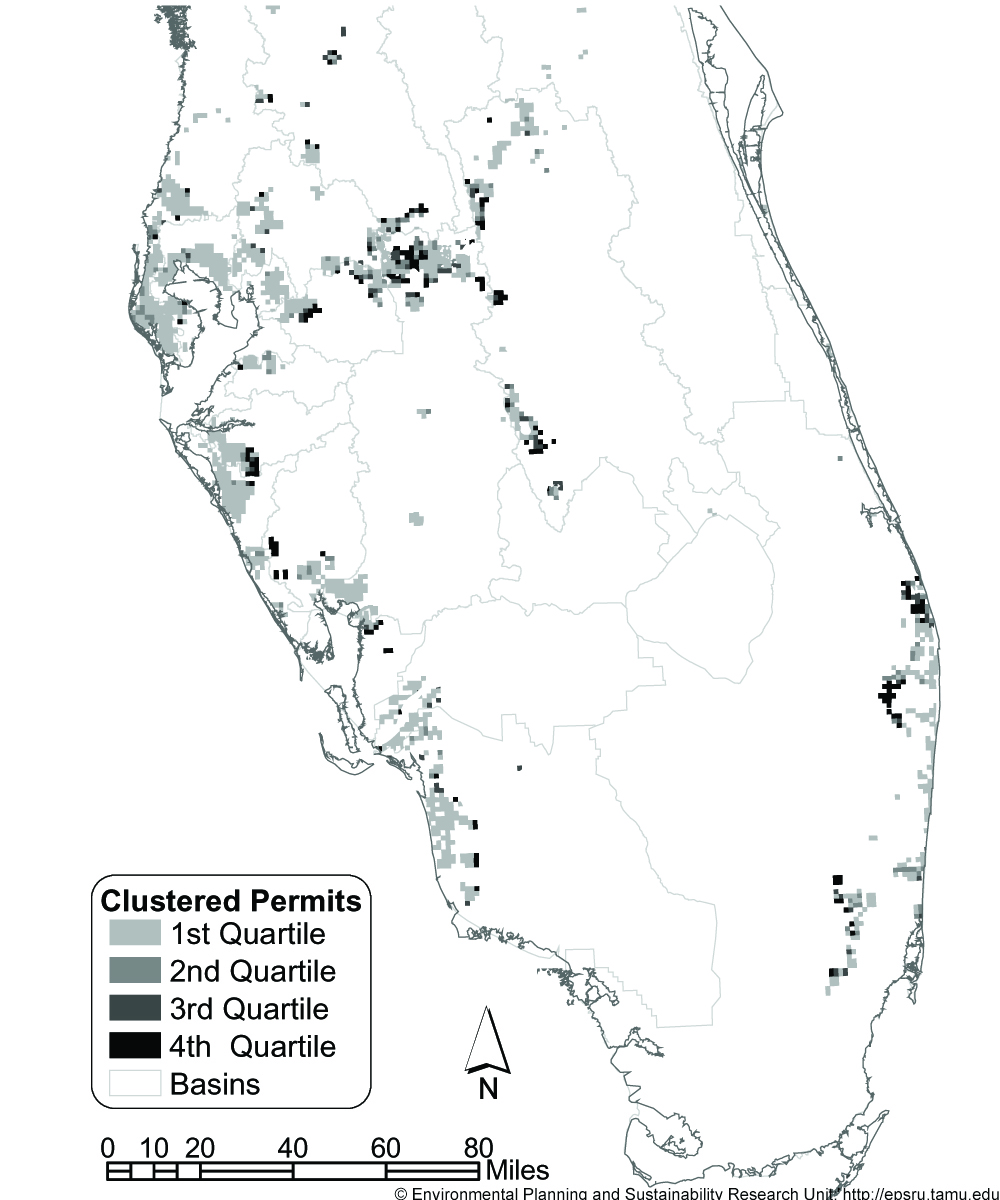
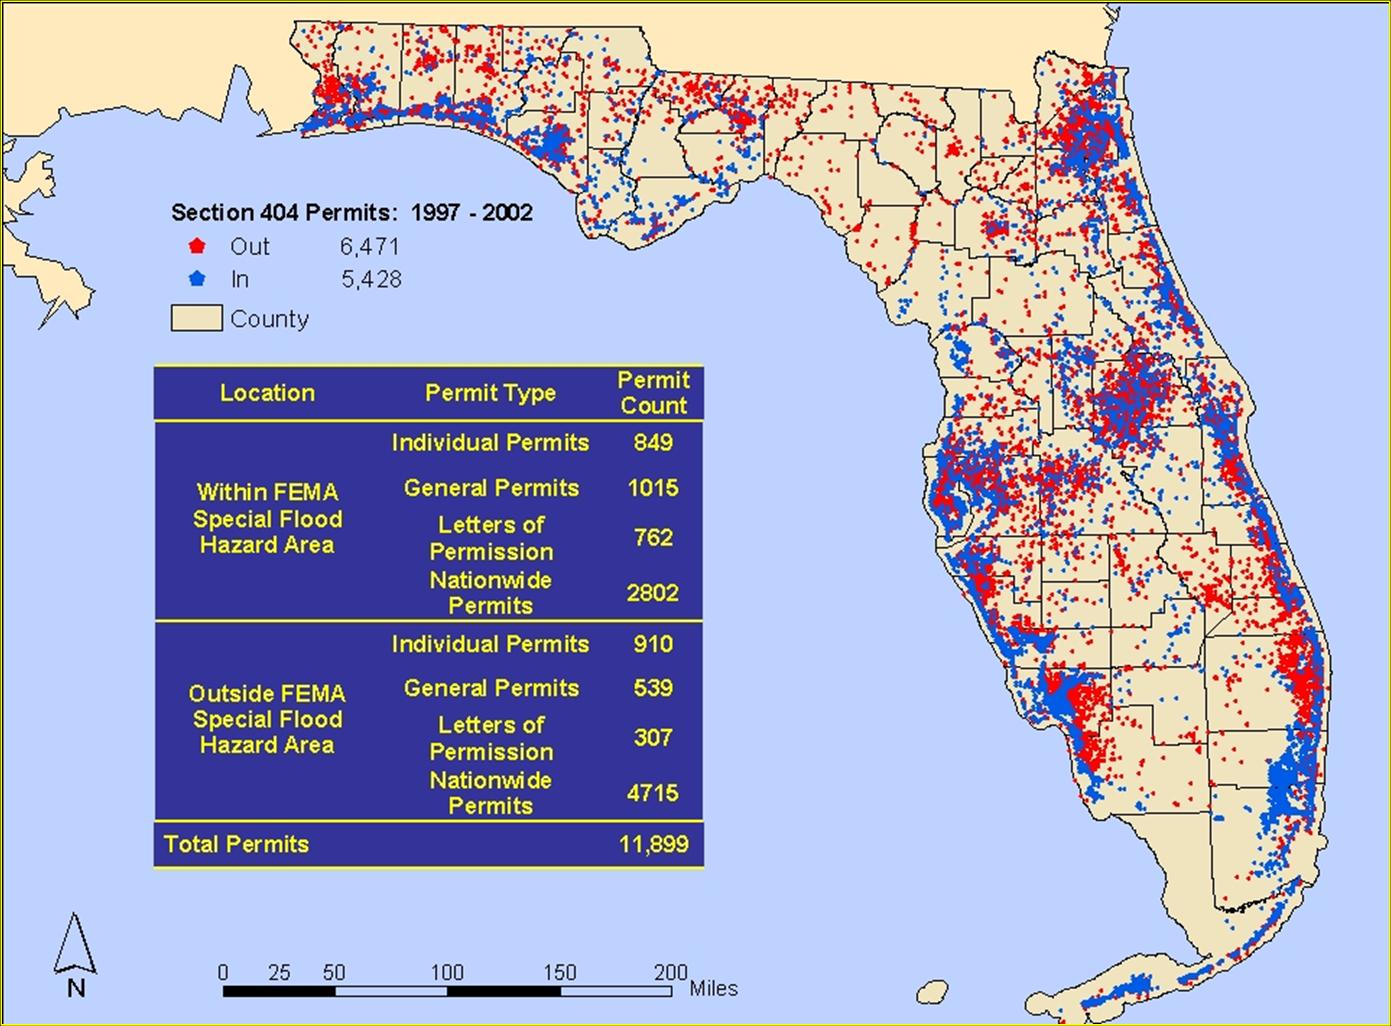
Mapped permits relative to watersheds in Florida.
Map created by Wes Highfield, EPSL. Base map layers from Florida Department
of Environmental Planning (DEP) and 404D township range section unit analysis. |
 |
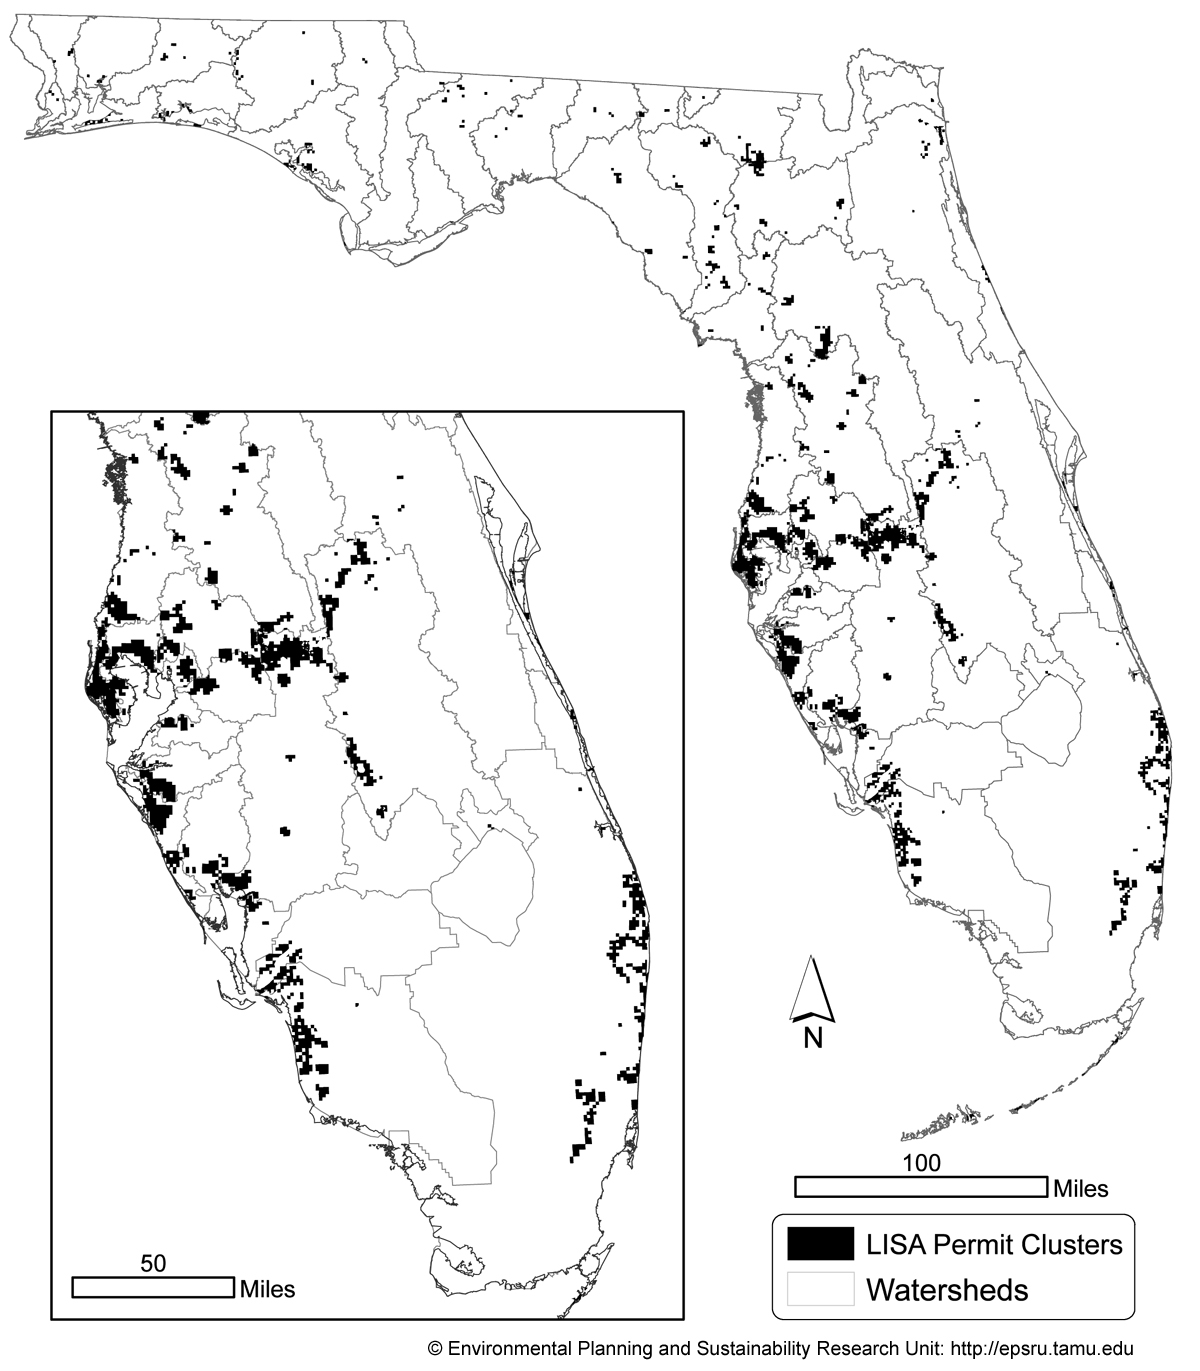
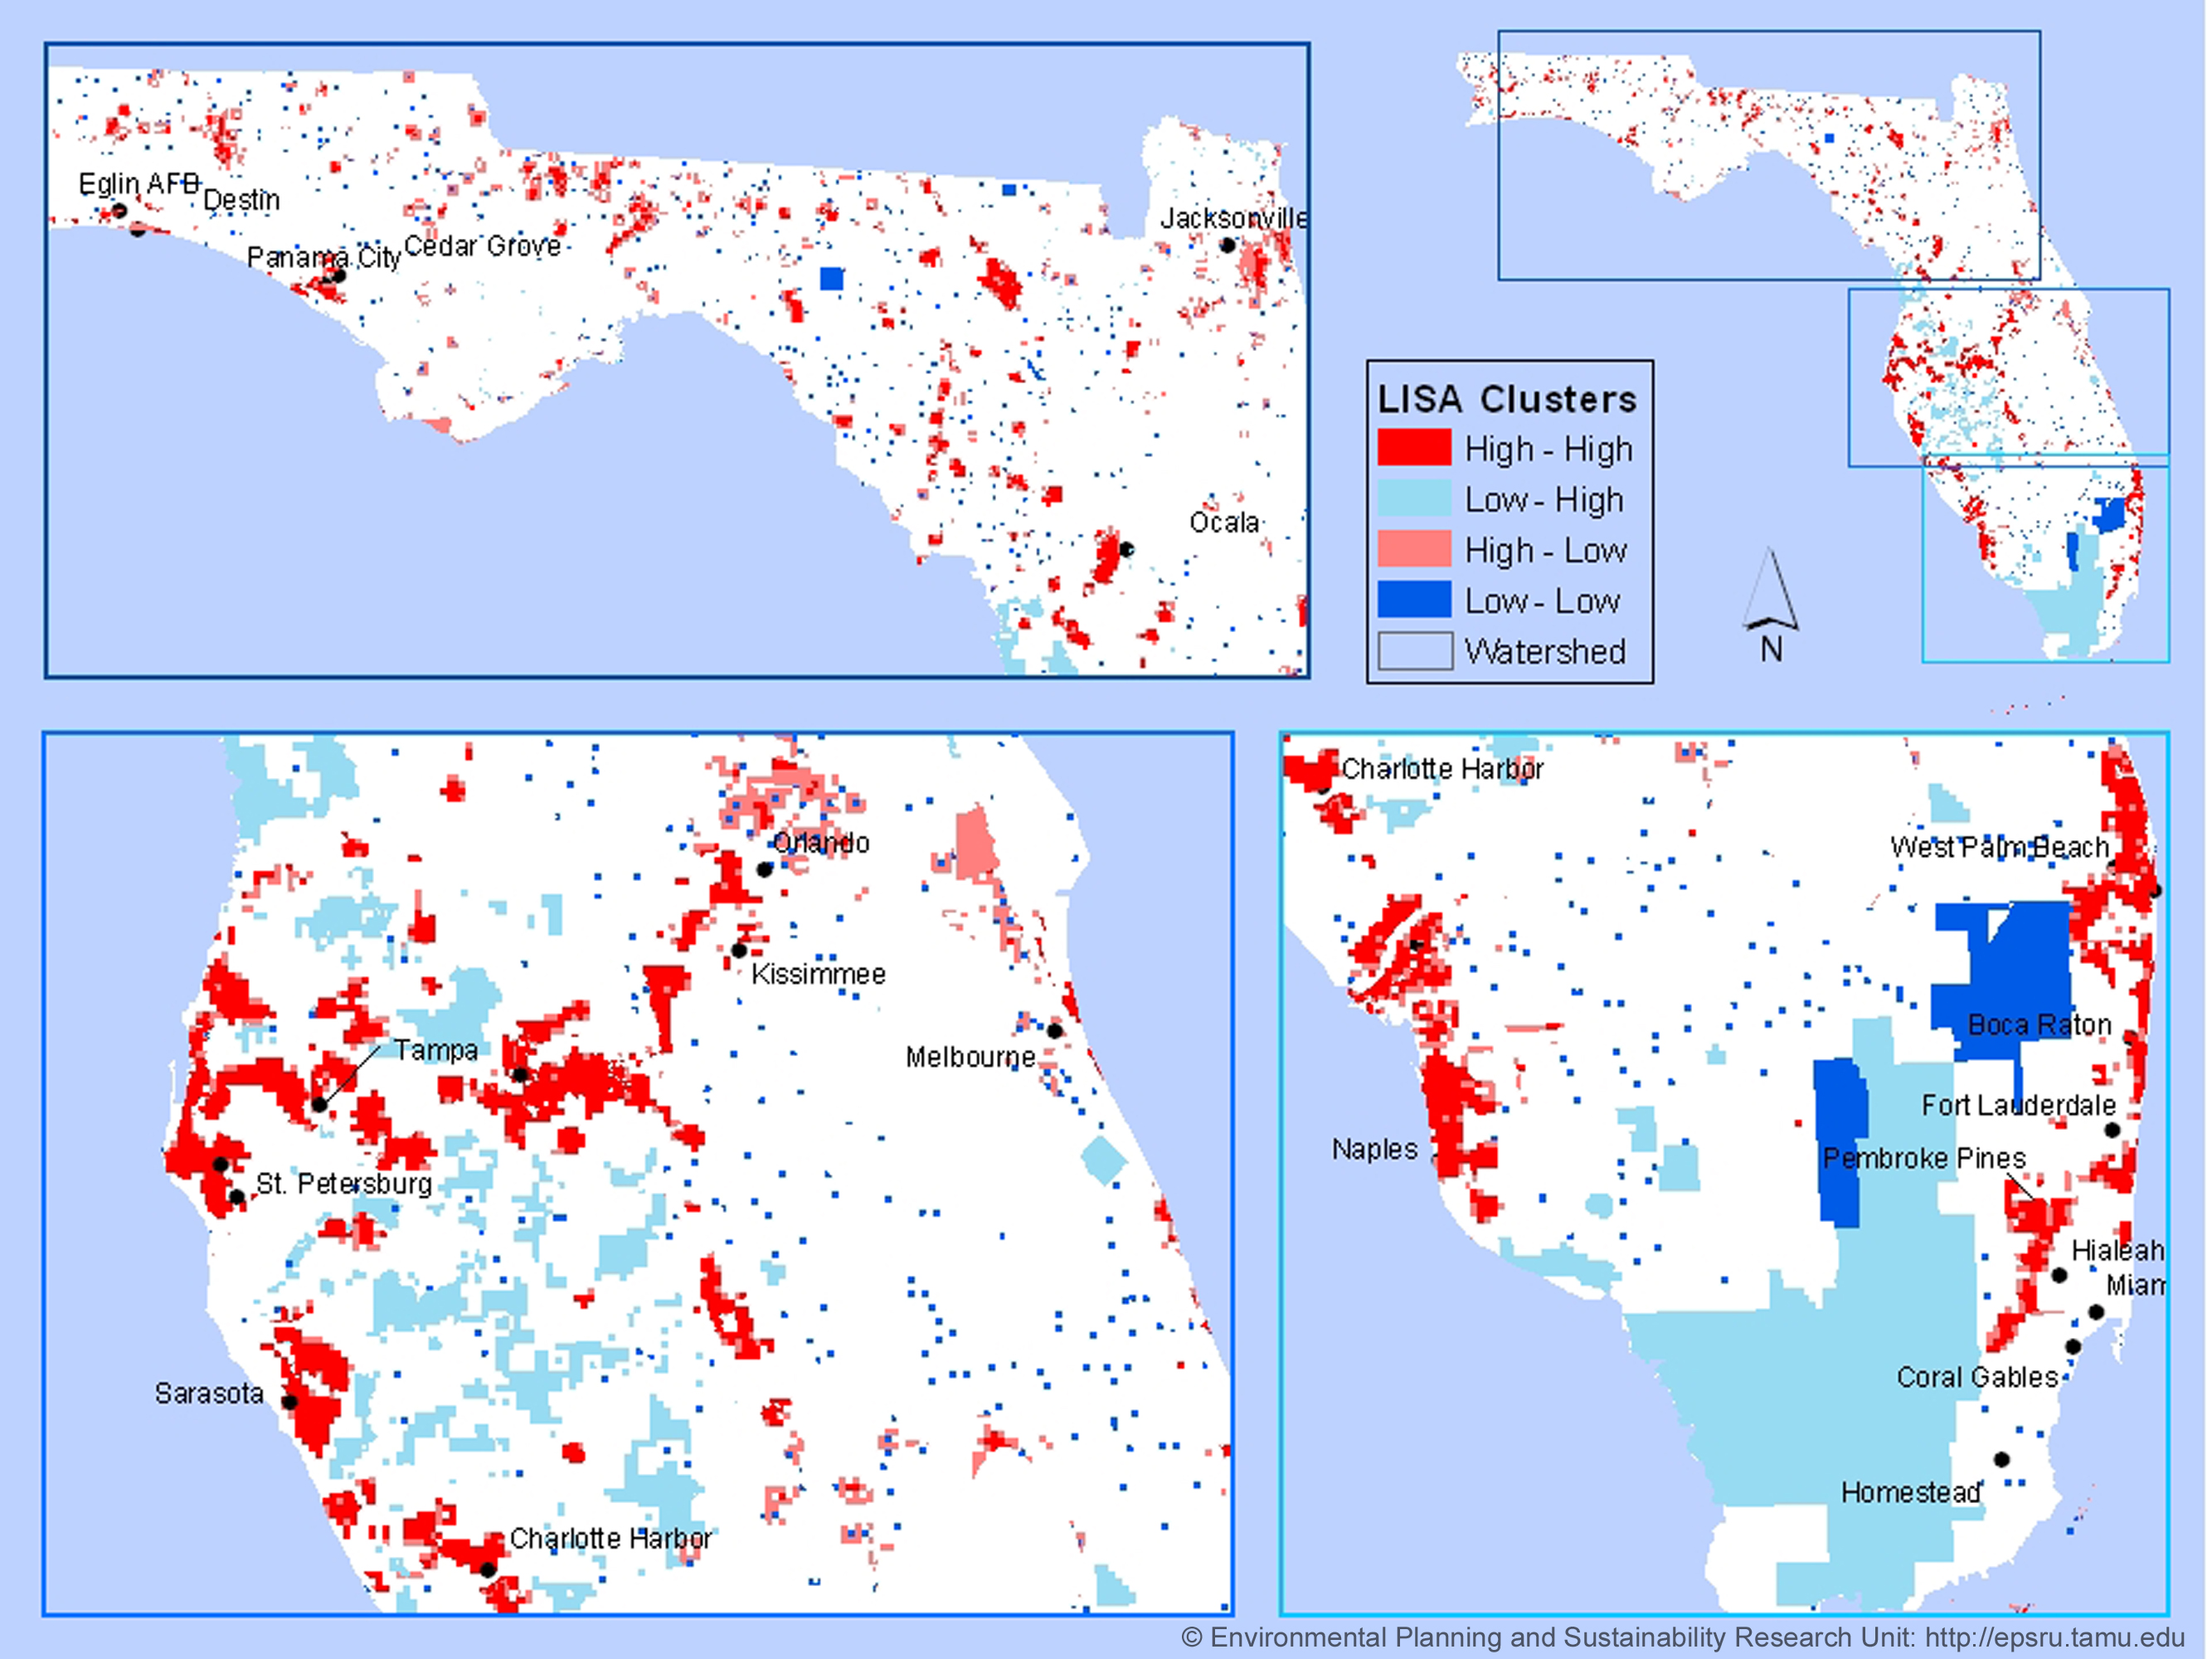
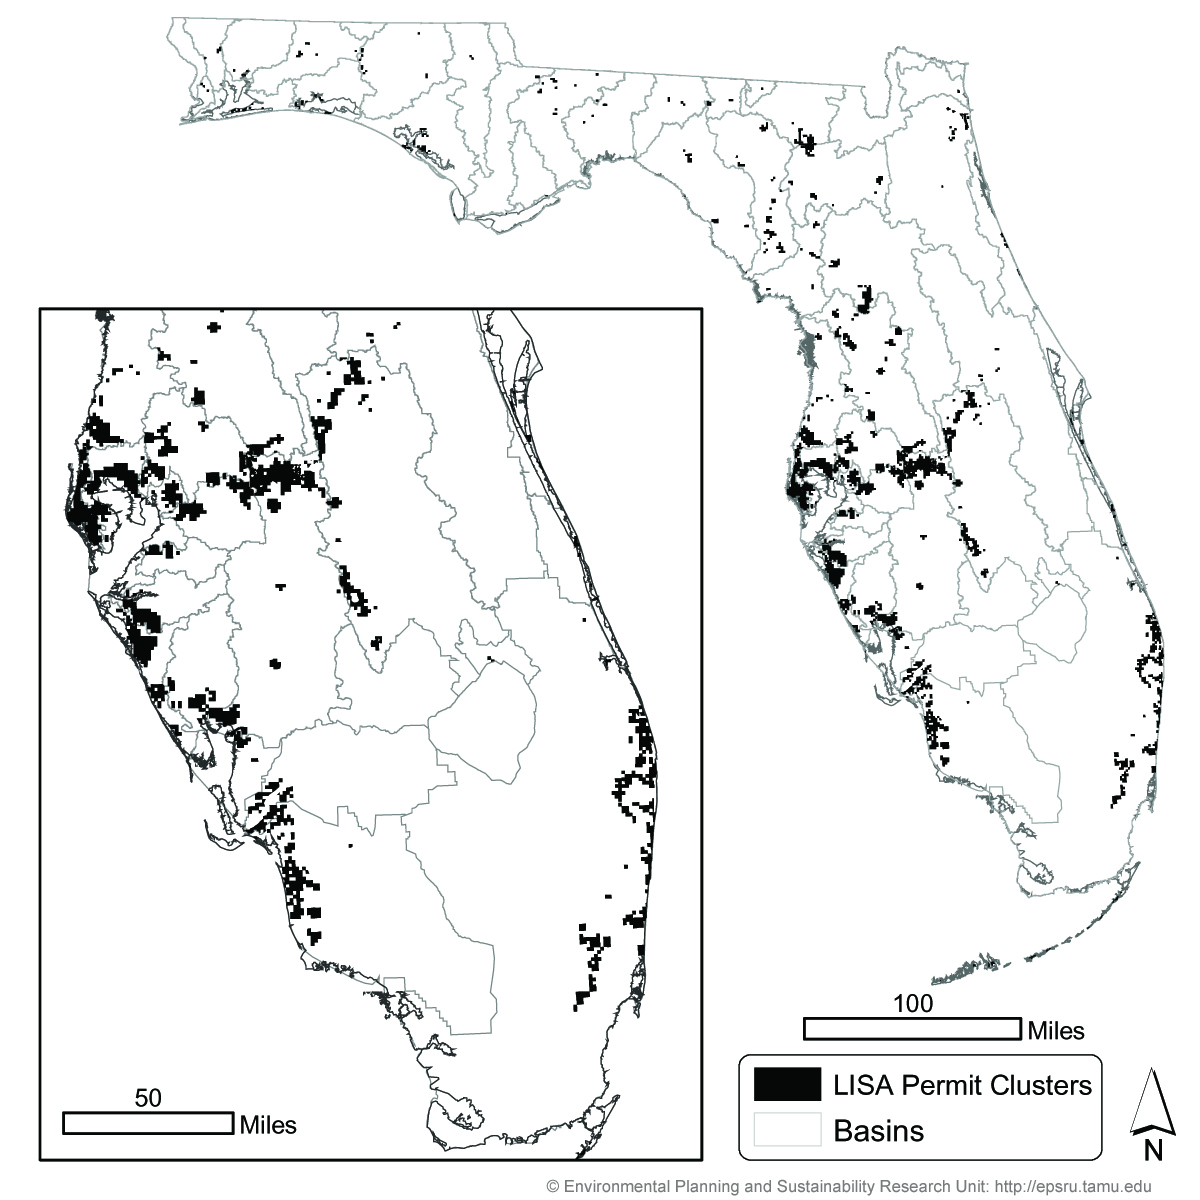
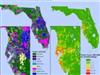
Clusters of permits identified by local Moran’s I
statistic or local indicator of spatial association (LISA) significant to
the p< .05 following randomization procedure. Same time frame (93-02).
Map created by Wes Highfield, EPSL. Base map layers from Florida Department
of Environmental Planning (DEP) and 404D township range section unit analysis. |
 |
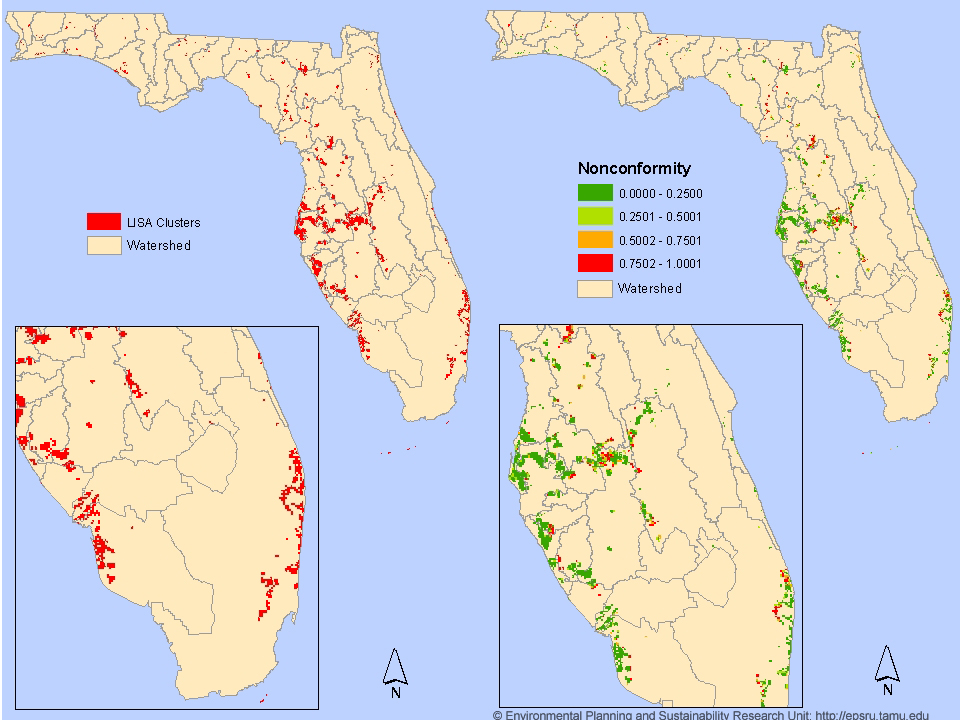
Areas of nonconformance created by overlaying future land
use with clusters of issued permits. Nonconformance ranges from 0-100% and
is subdivided for the purposes here into quartiles. Map created by Wes Highfield,
EPSL. Base map layers from Florida Department of Environmental Planning
(DEP). |
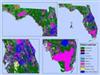 |
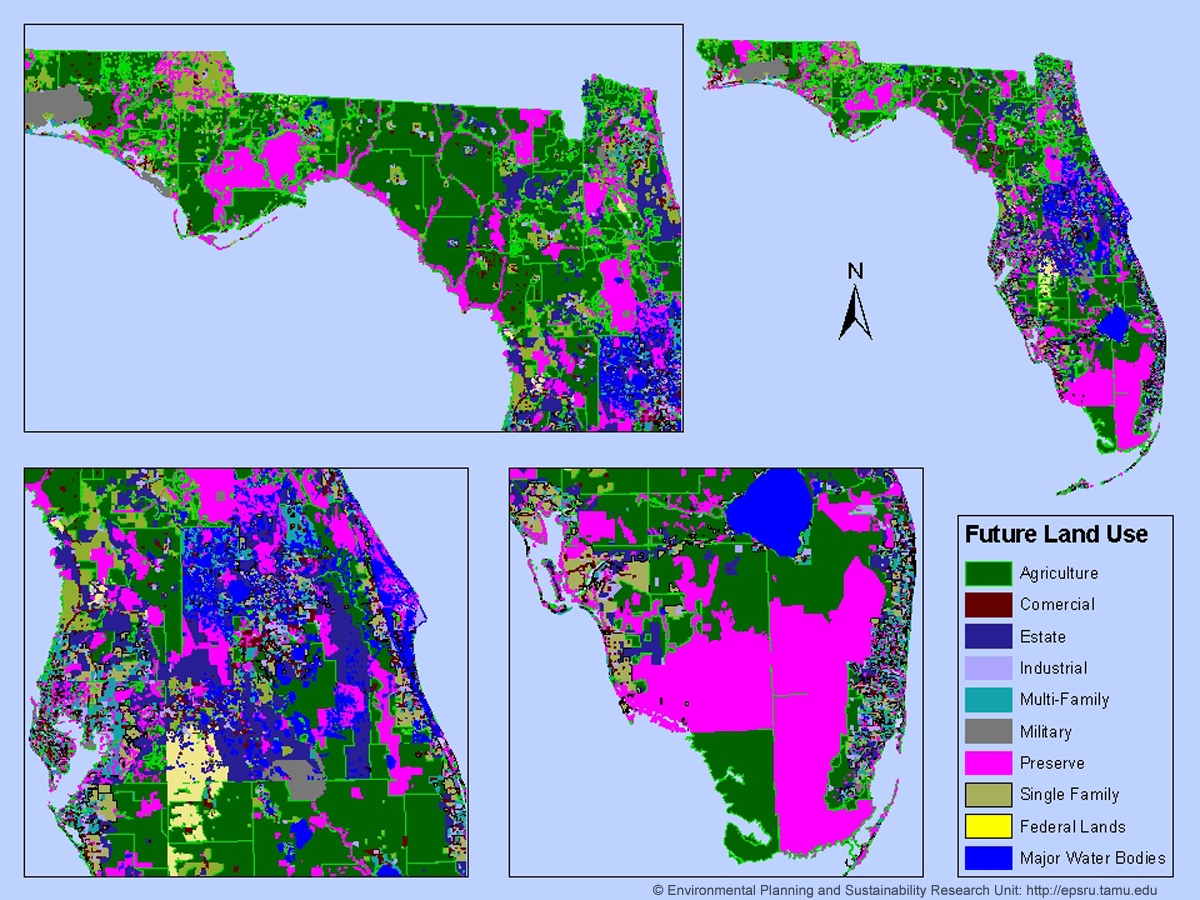
Future land use (1993) compiled from Florida’s
11 regional planning councils which encompass 458 local municipalities.
Map created by Wes Highfield, EPSL. Base map layers from Florida Geographic
Data Library, University of Florida. |
 |
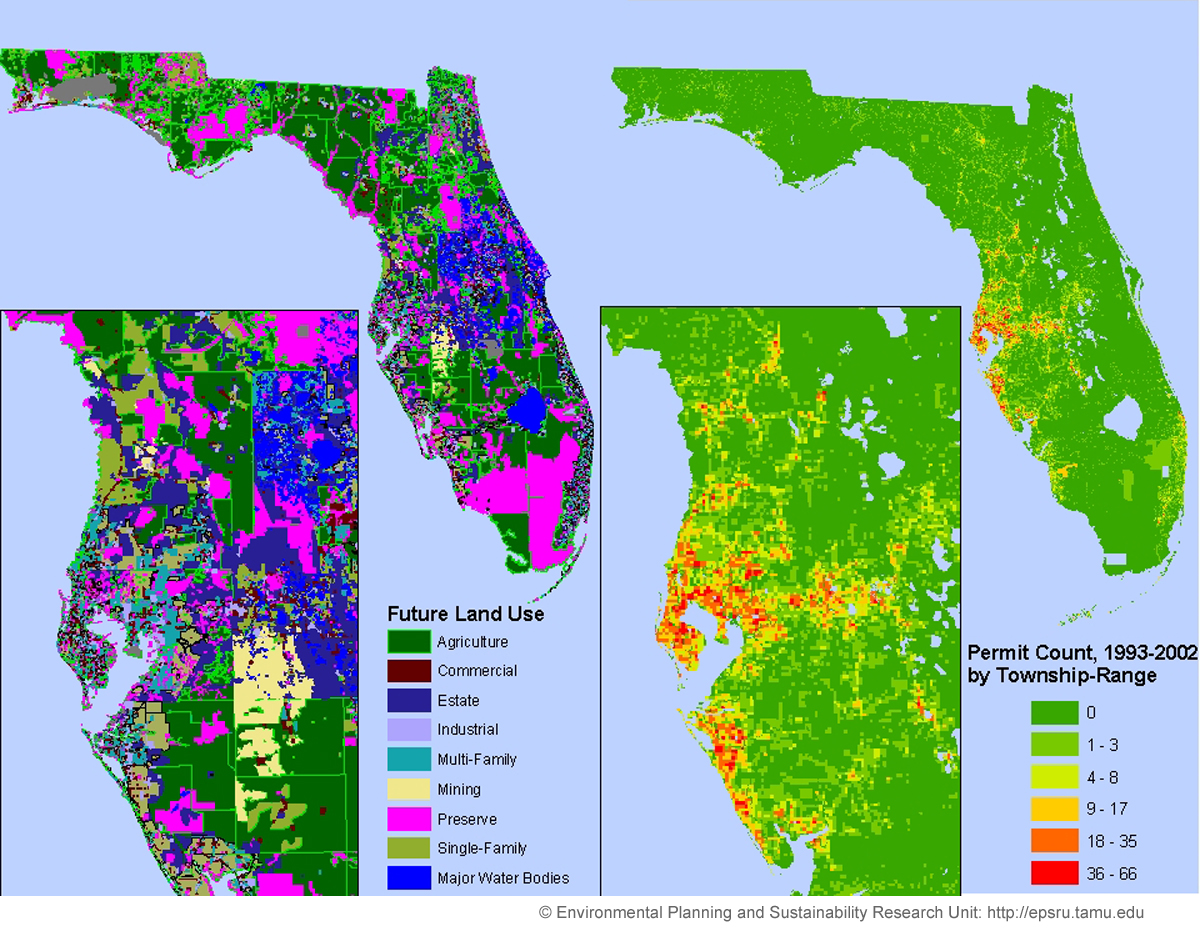
Future land use (1993) compiled from Florida’s 11
regional planning councils which encompass 458 local municipalities and
permit counts from 1993-2002 with special attention to Sarasota /Tampa/Pinellas.
. Map created by Wes Highfield, EPSL. Base map layers from Florida Geographic
Data Library, University of Florida and Florida Department of Environmental
Planning (DEP). |
• Brody, S.D., Wesley E. Highfield, and Sara Thornton.
(Forthcoming). Planning At the Urban Fringe: An Examination of the Factors
Influencing Nonconforming Development Patterns in Southern Florida. Environment
and Planning B.
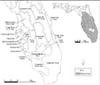 |
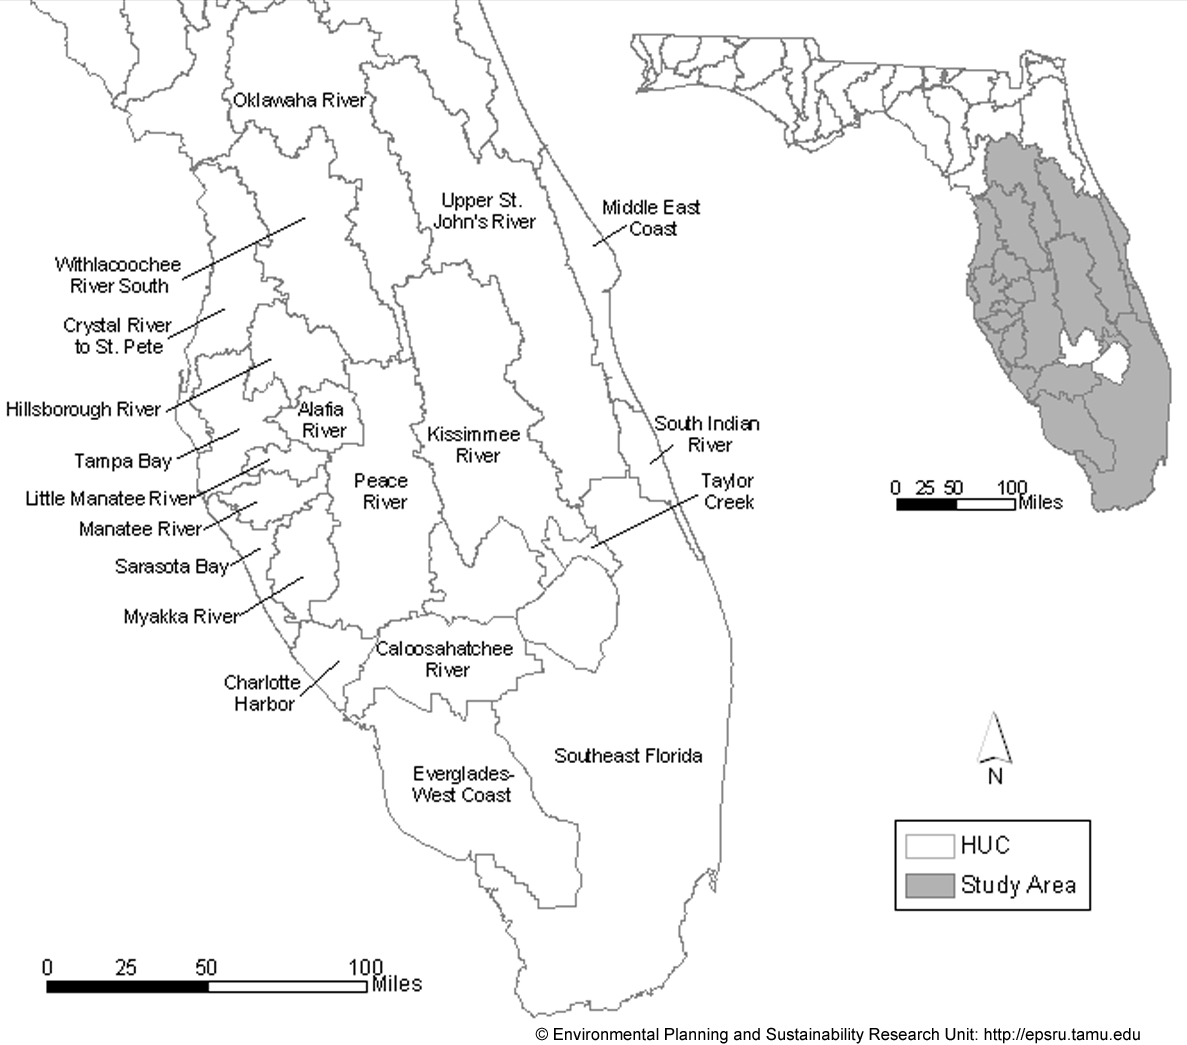
Study area, south Florida hydrological units of concern
(HUCs). |
 |
Nonconforming LISA clusters in south Florida study area. |
 |
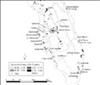
Florida cities, LISA clusters & hydrologic unit codes
(HUCs). |
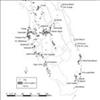
A Multi-Criteria Spatial Site Suitability Analysis for Oil and Gas Exploration in Texas
 |
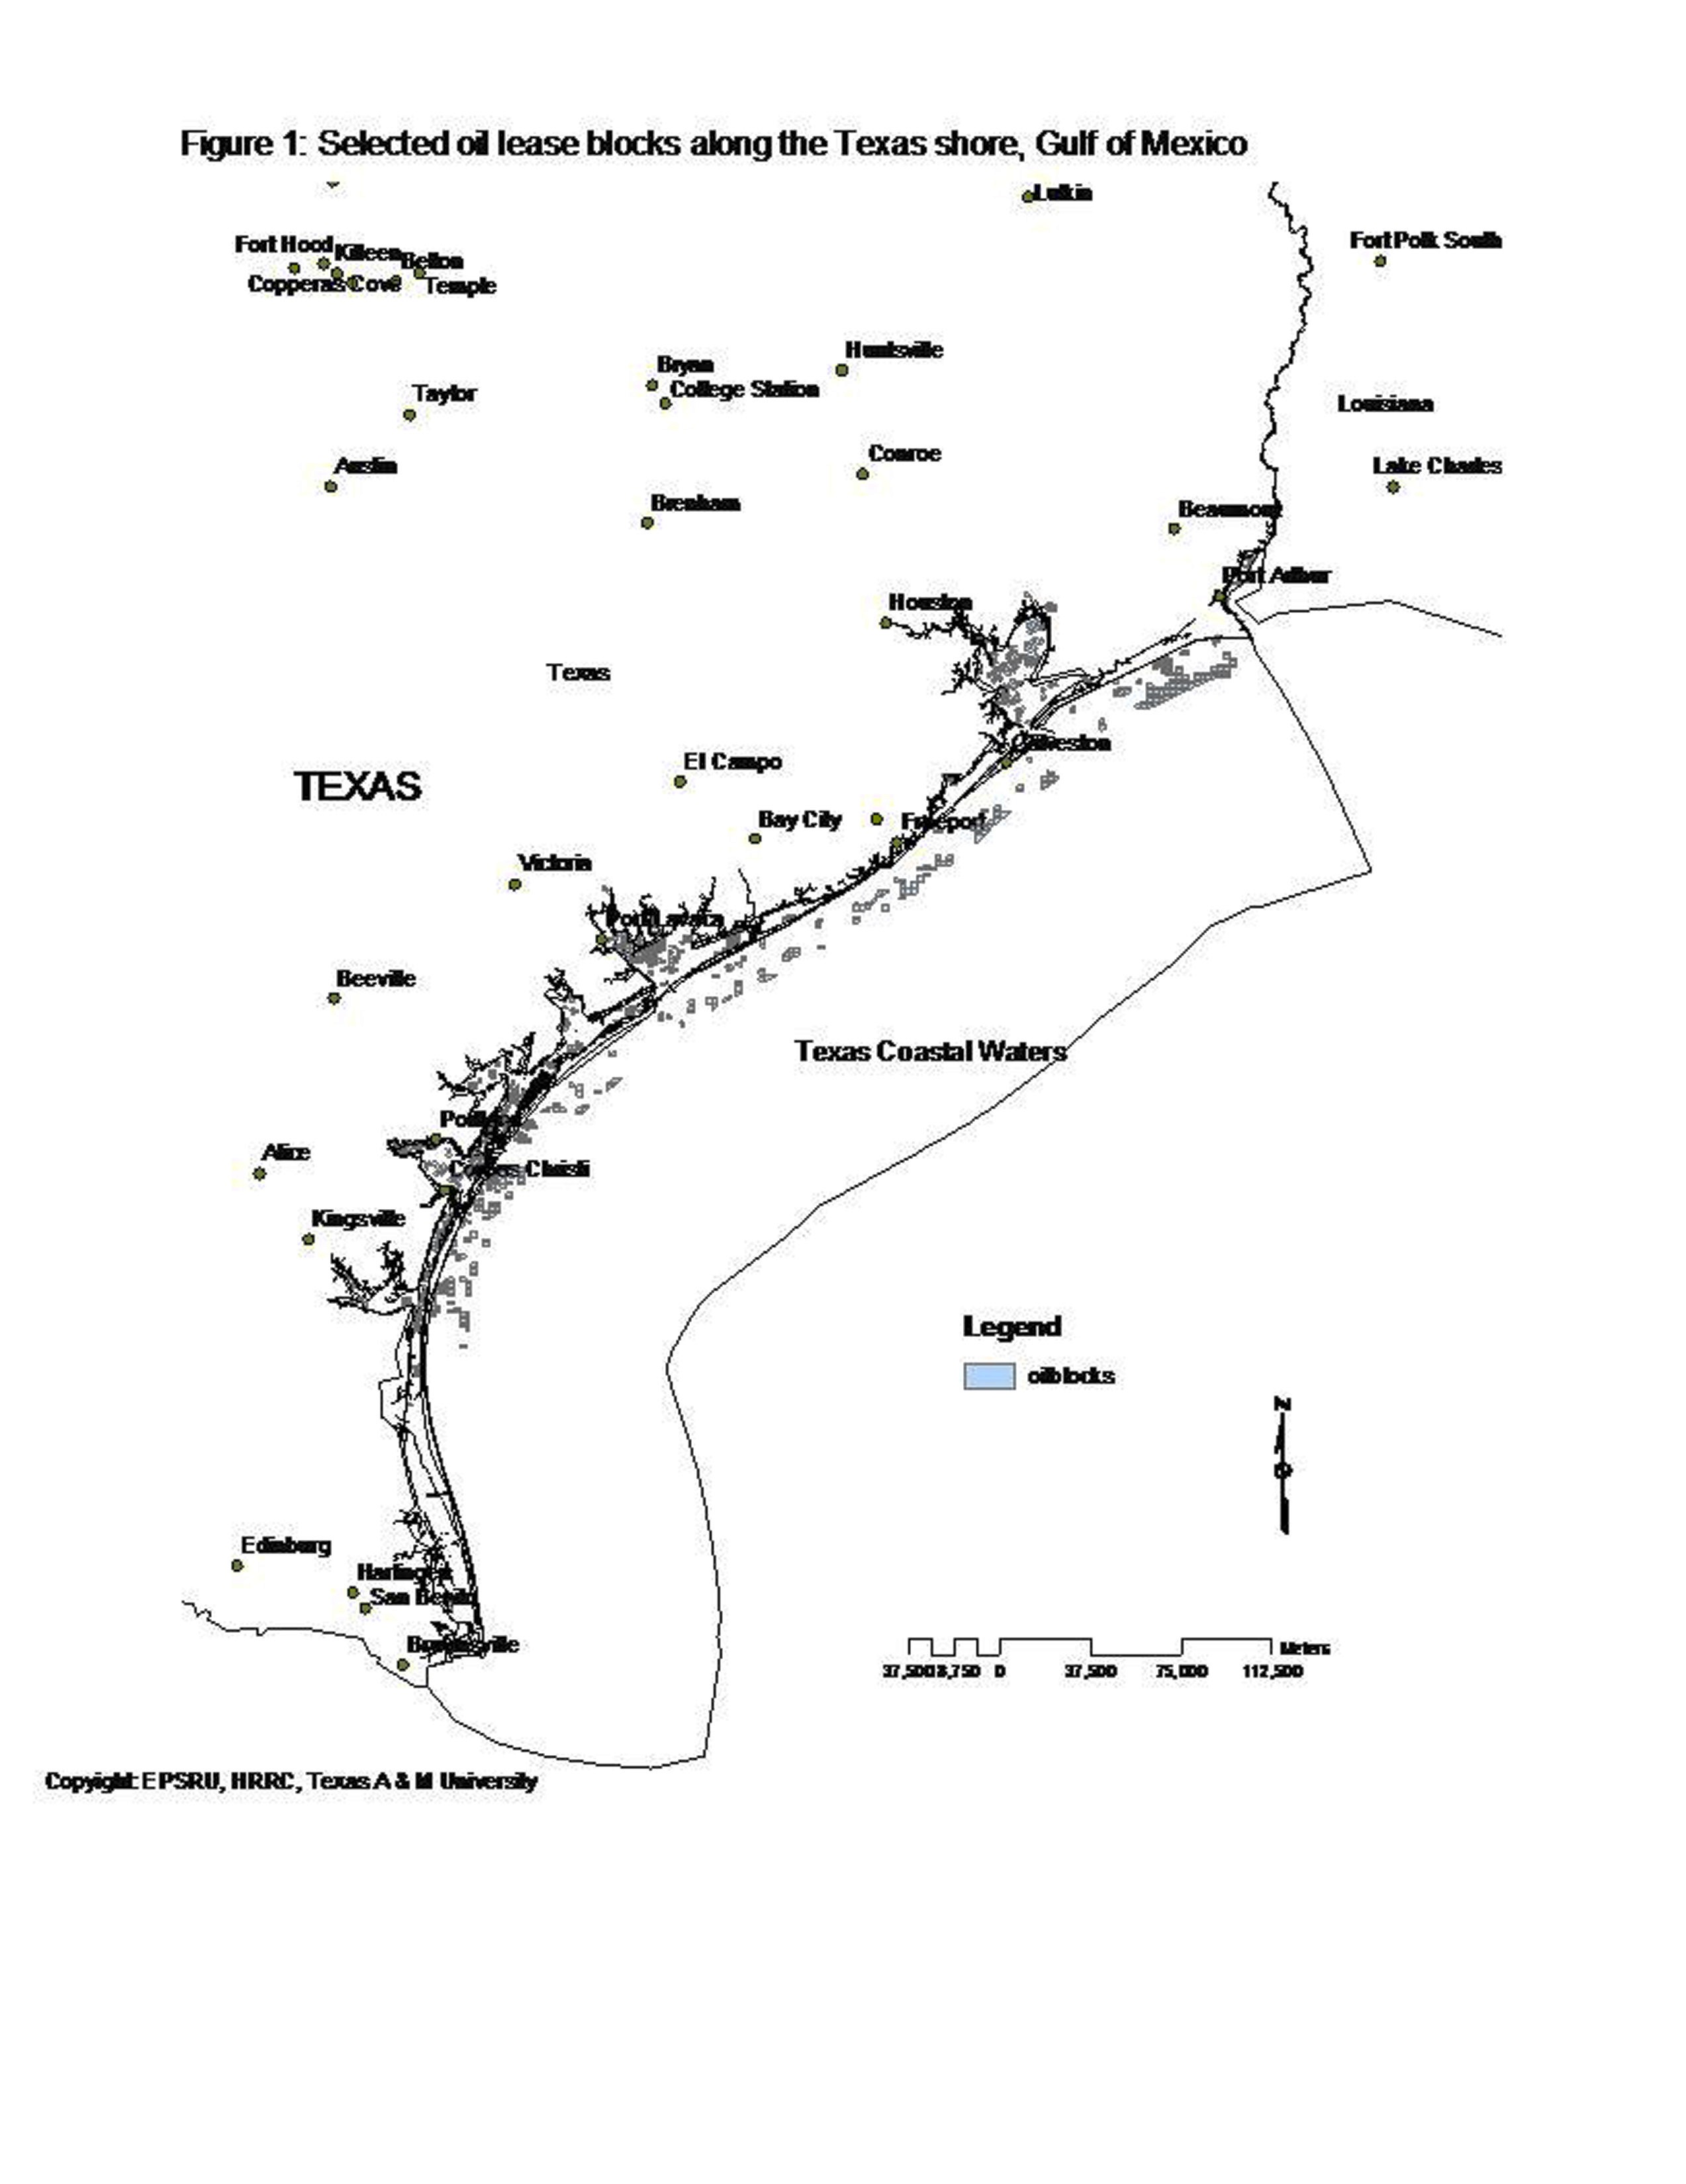
Figure 1.Oil lease blocks in Texas coastal waters. |
 |
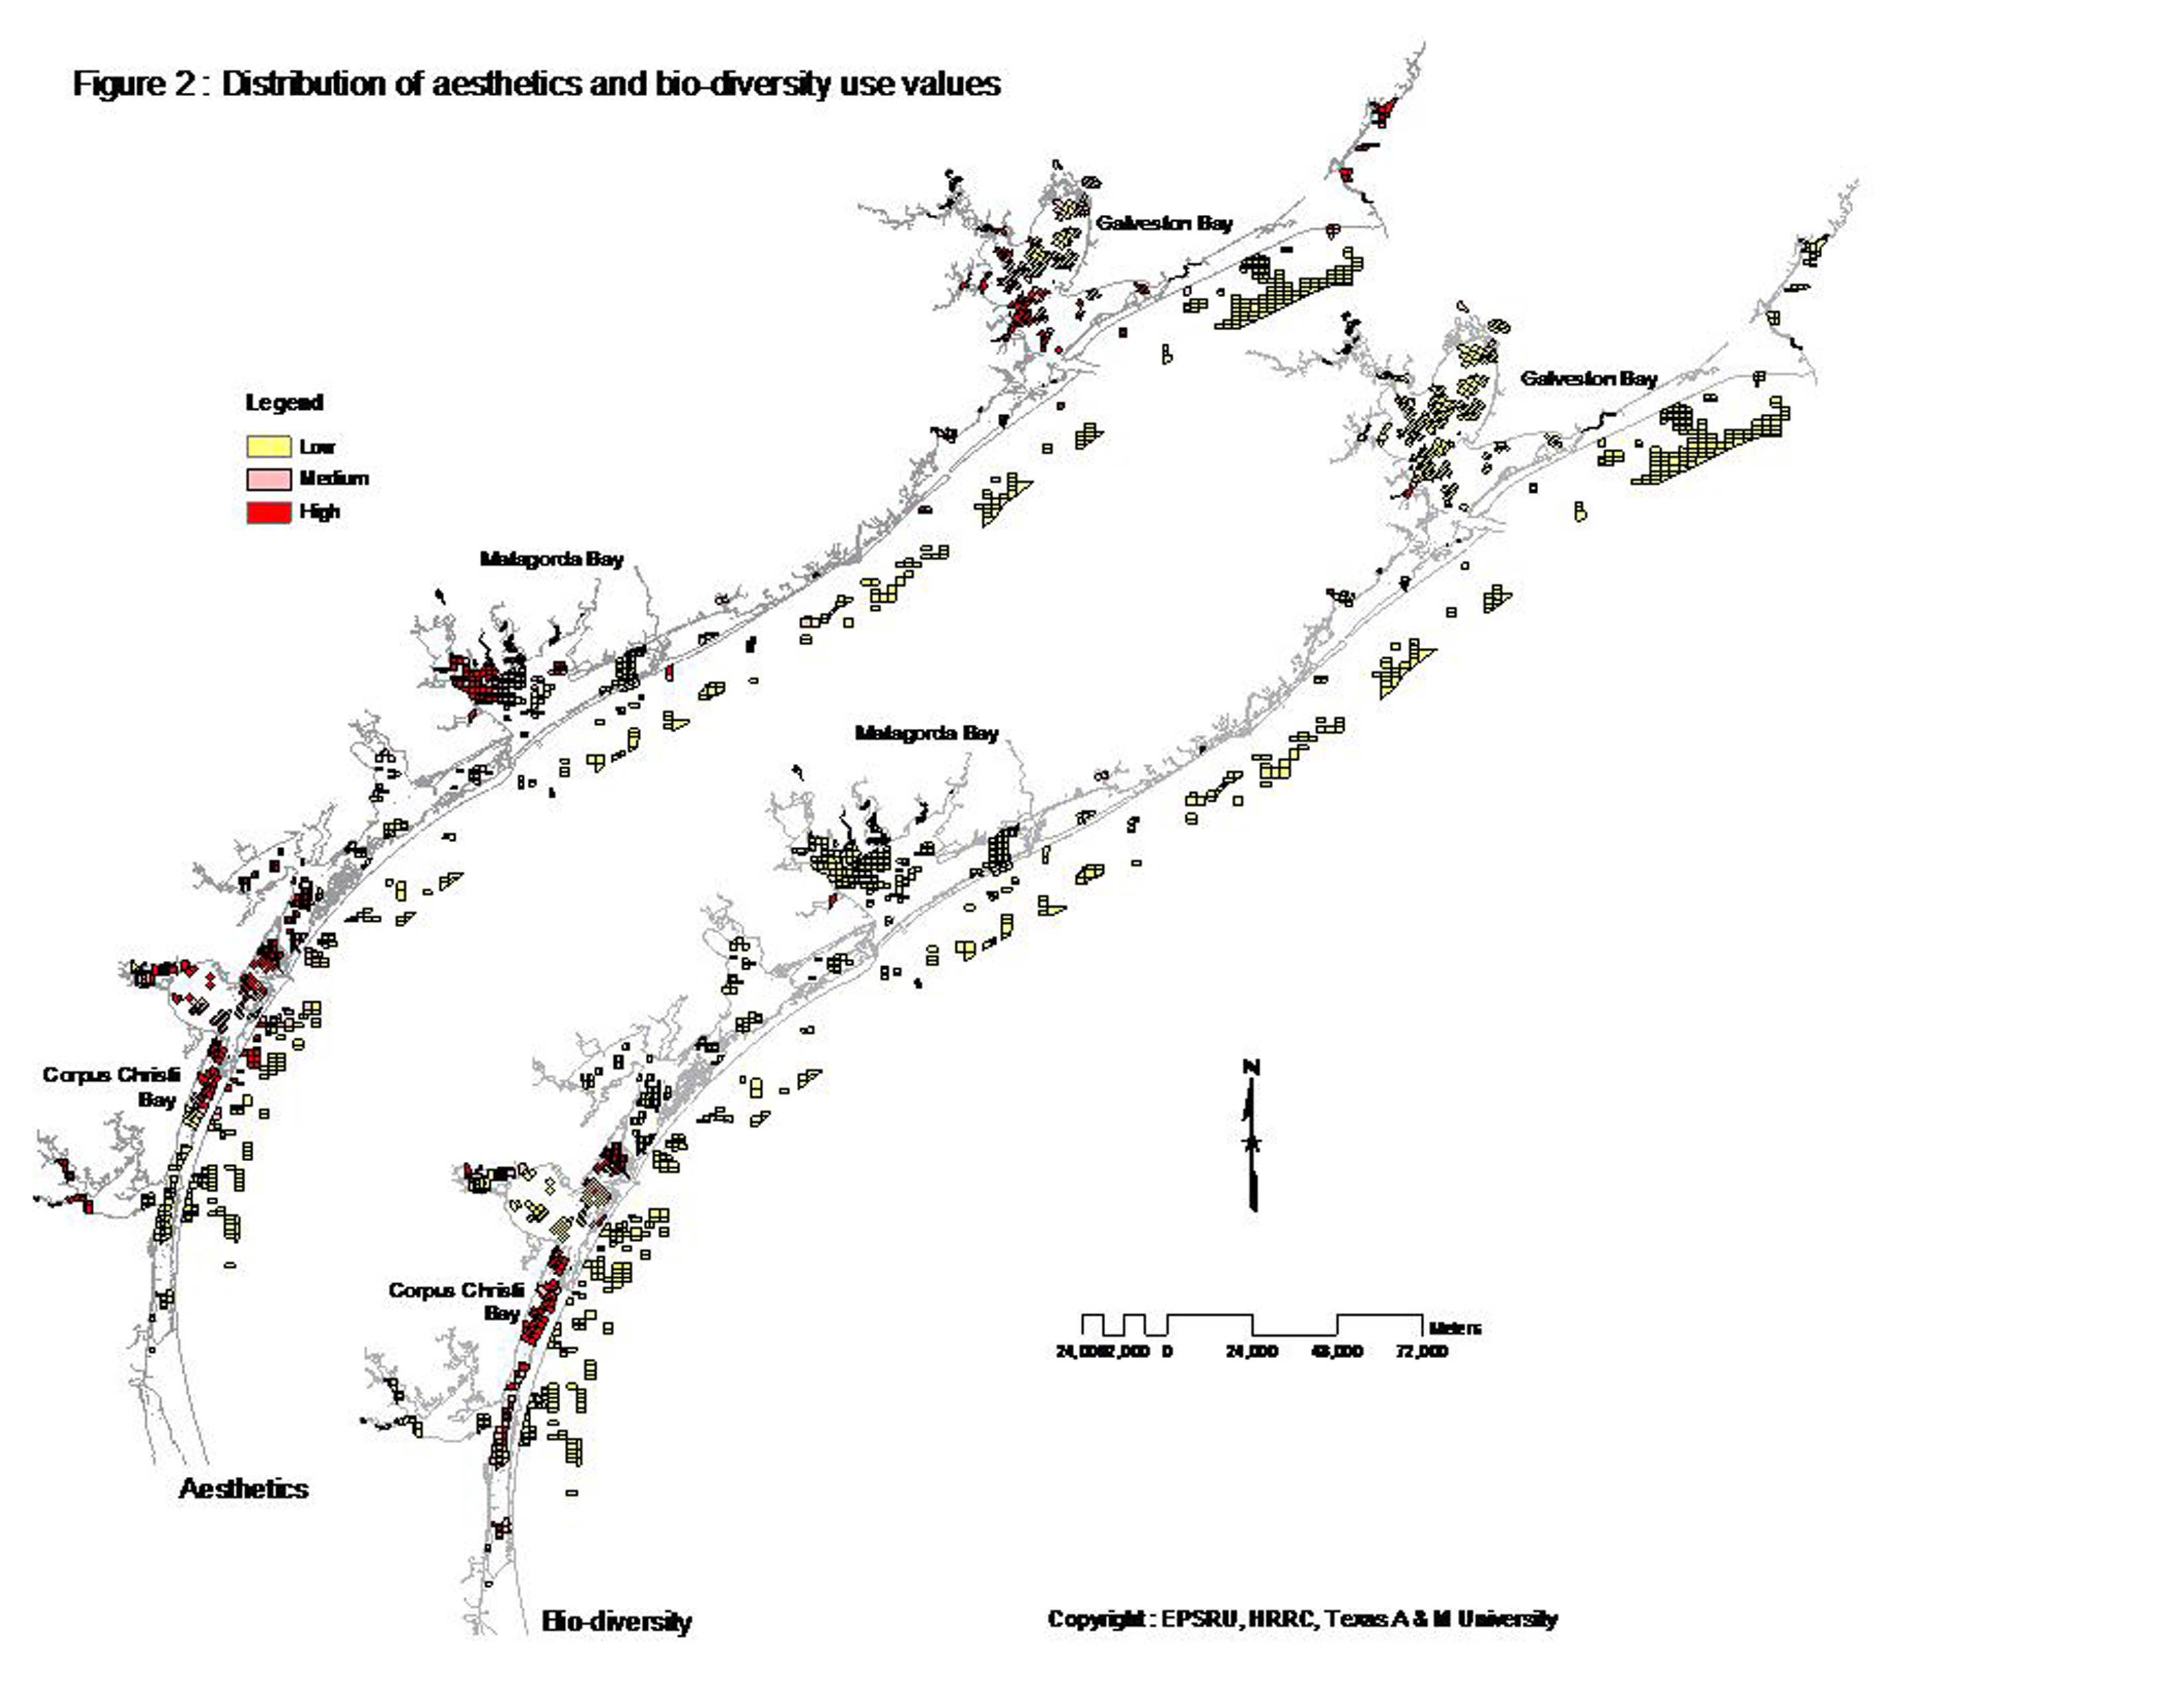
Figure 2. Distribution of aethetics and biodiversity values. |
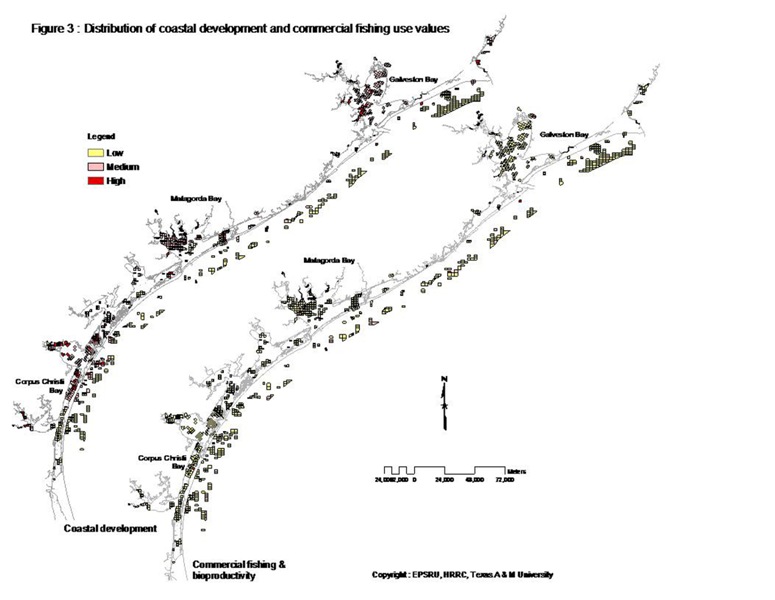 |
Figure 3. Distribution of coastal development and commerical fishing values. |
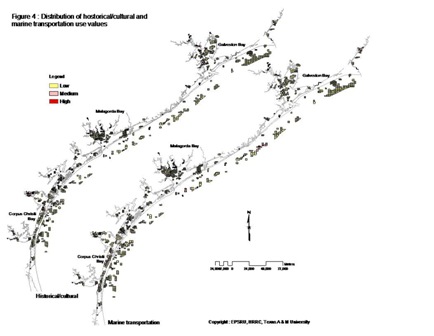 |
Figure 4. Distribution of historical/cultural and marine transportation values. |
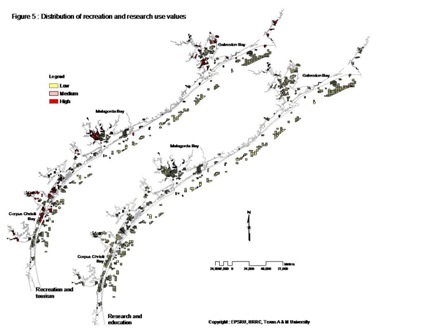 |
Figure 5. Distribution of recreation and research values. |
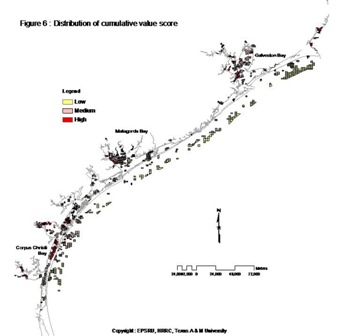 |
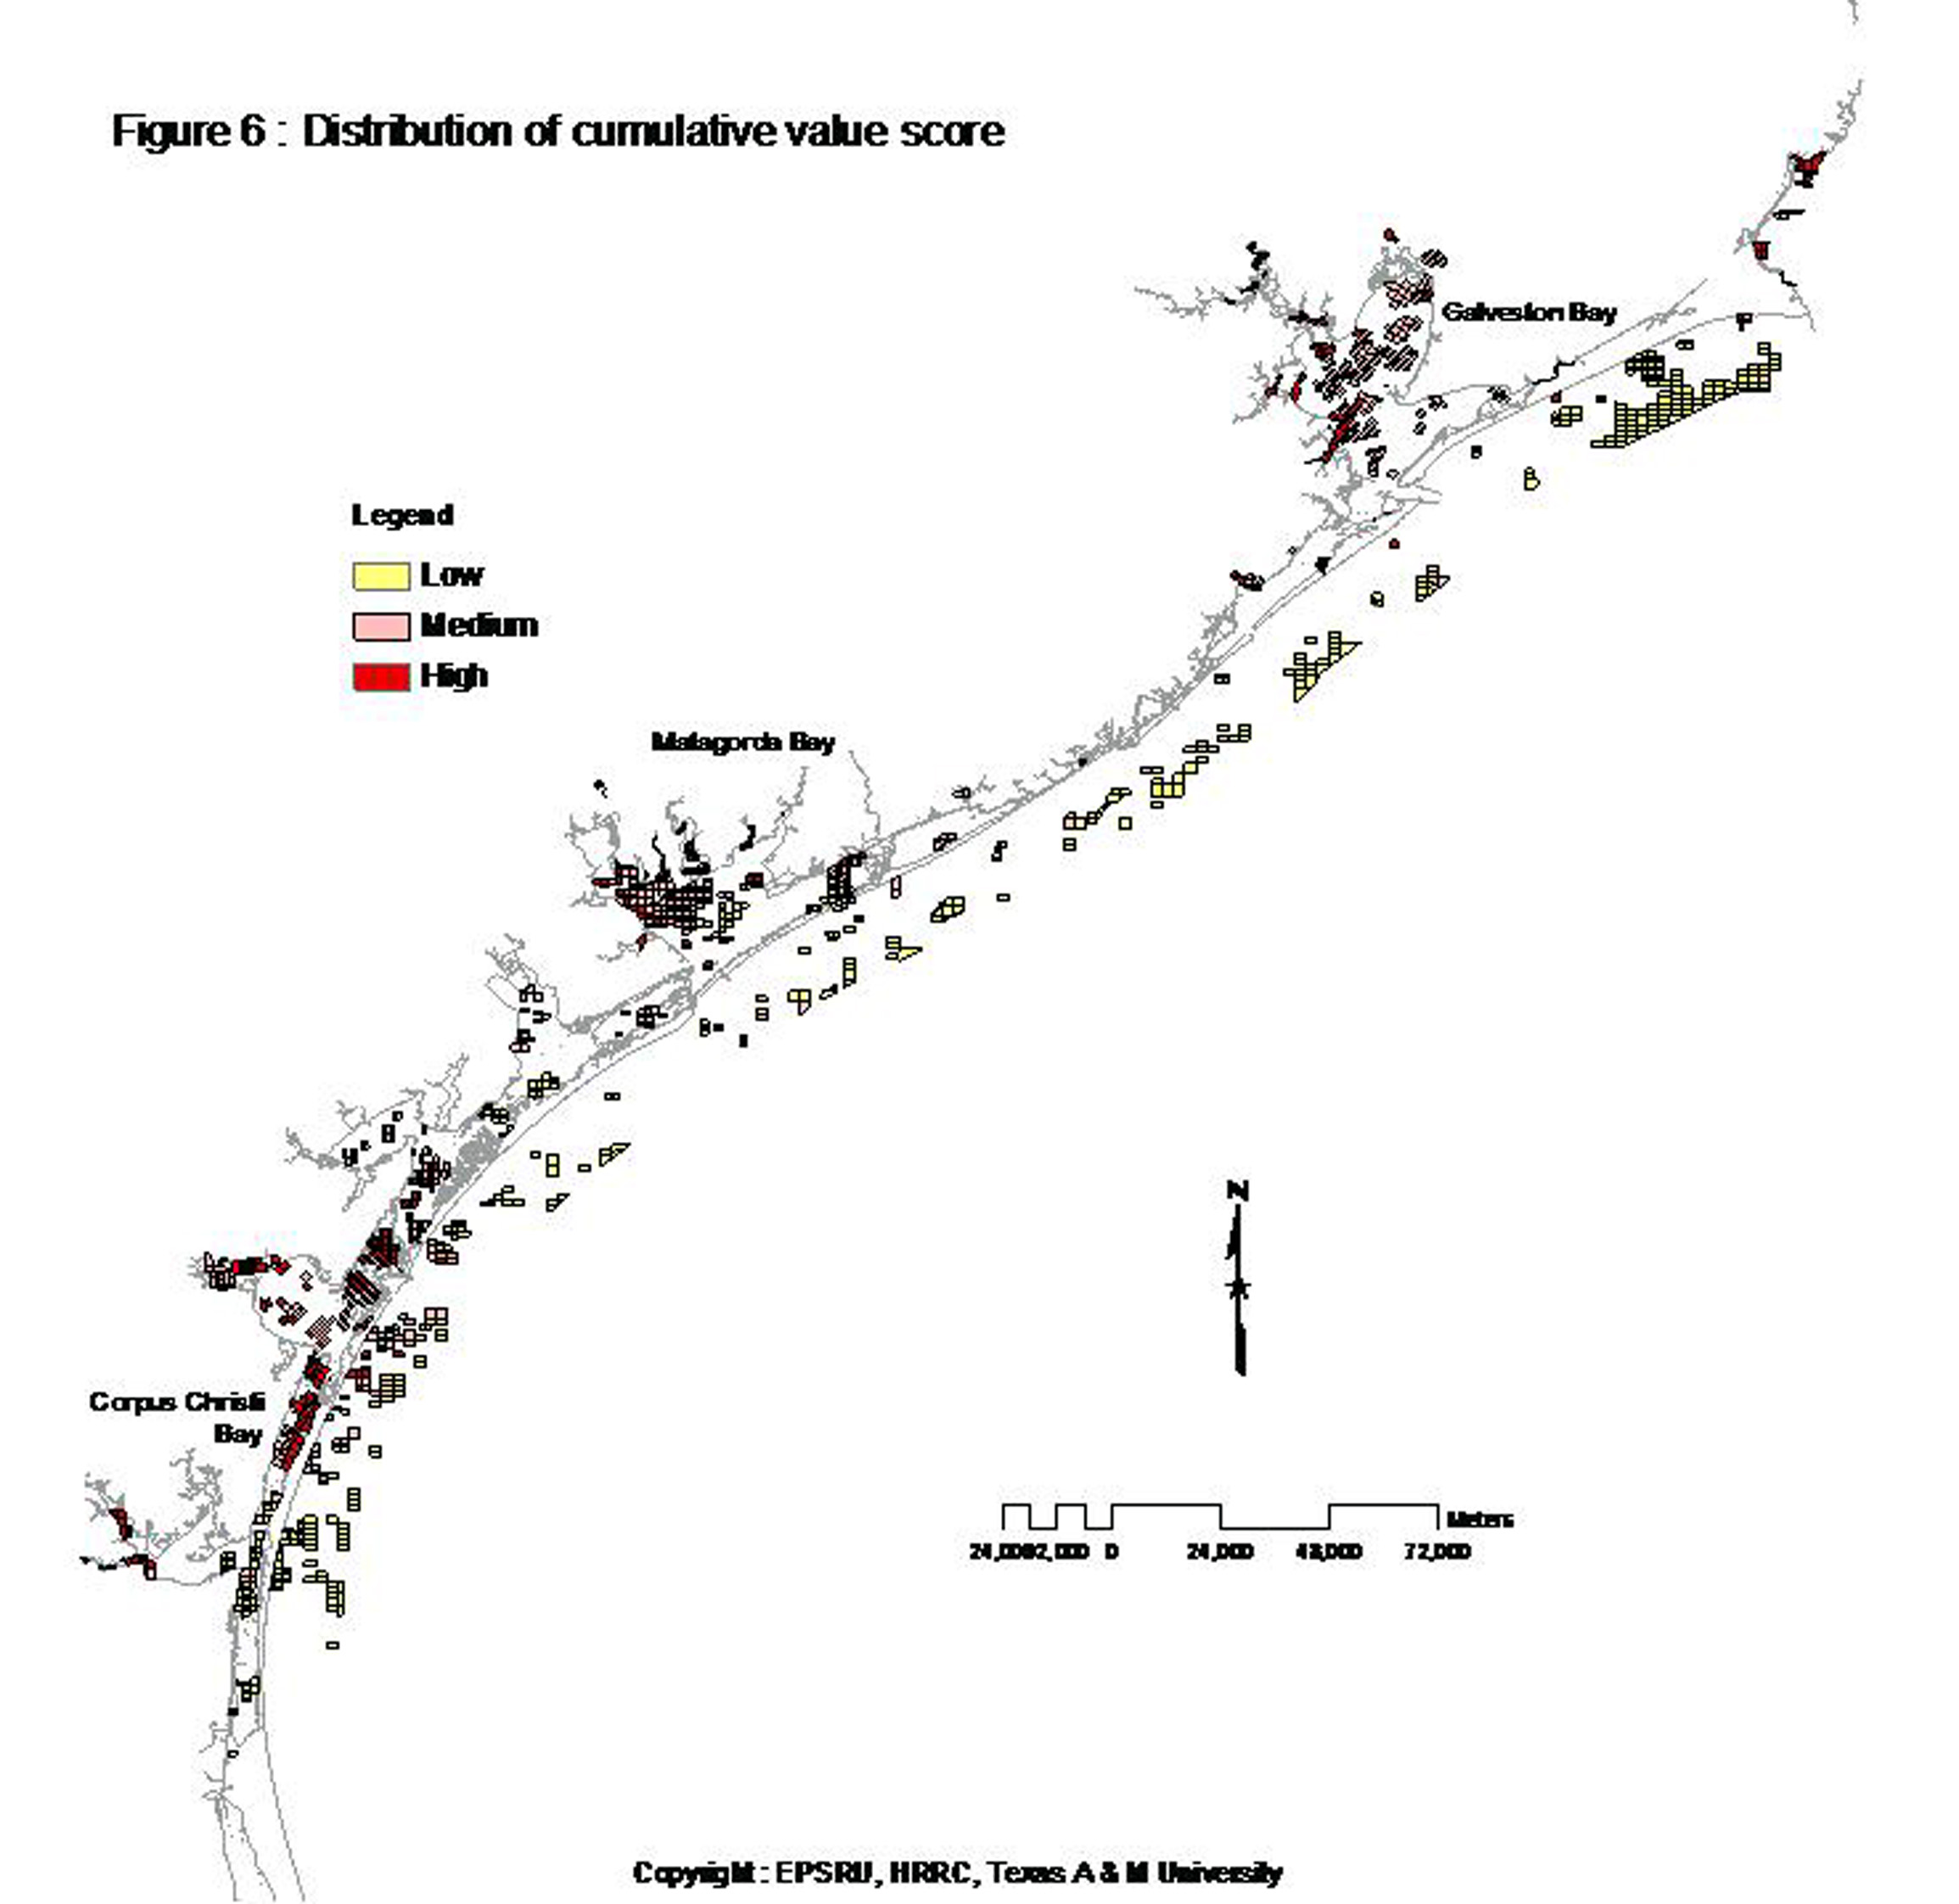
Figure 6. Distribution of cumulative values for offshore oil and gas production. |
Ecosystem Planning in Florida
• Evaluating Ecosystem Management Capabilities
at the Local Level in Florida: Identifying Policy Gaps Using Geographic Information
Systems Brody, S.D., Carassco, V. & Highfield, W. (2003). Environmental
Management 32(6): 661-681.
 |
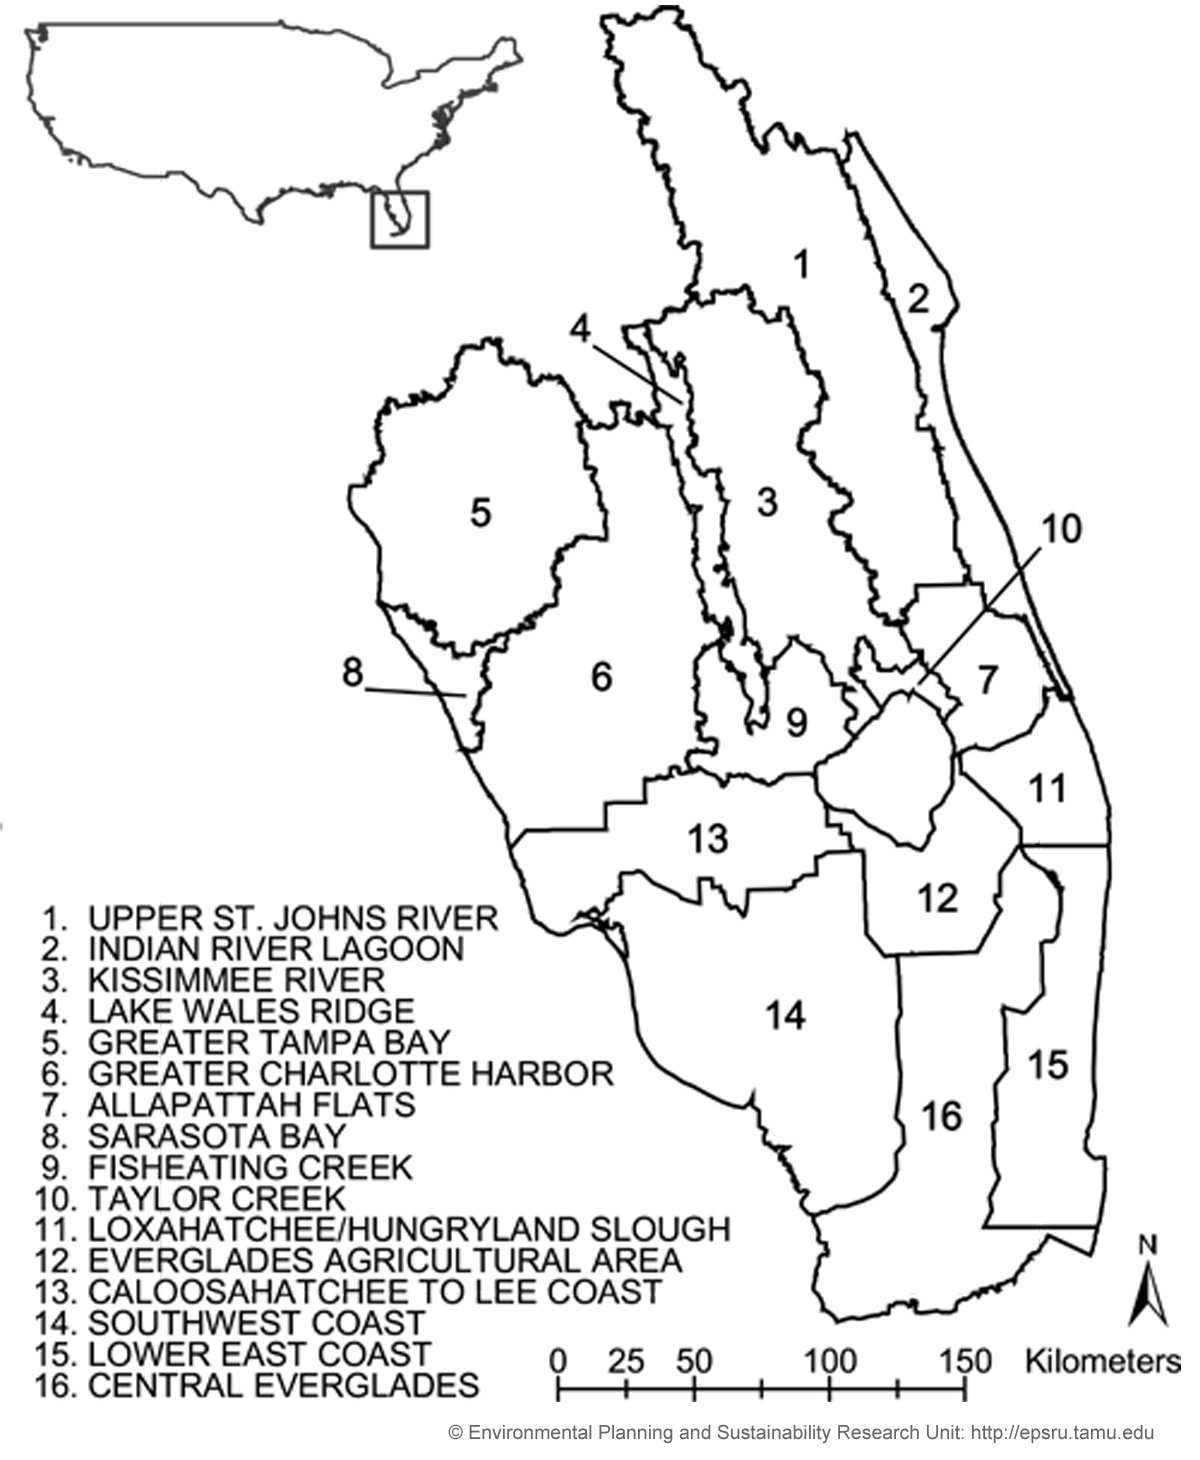
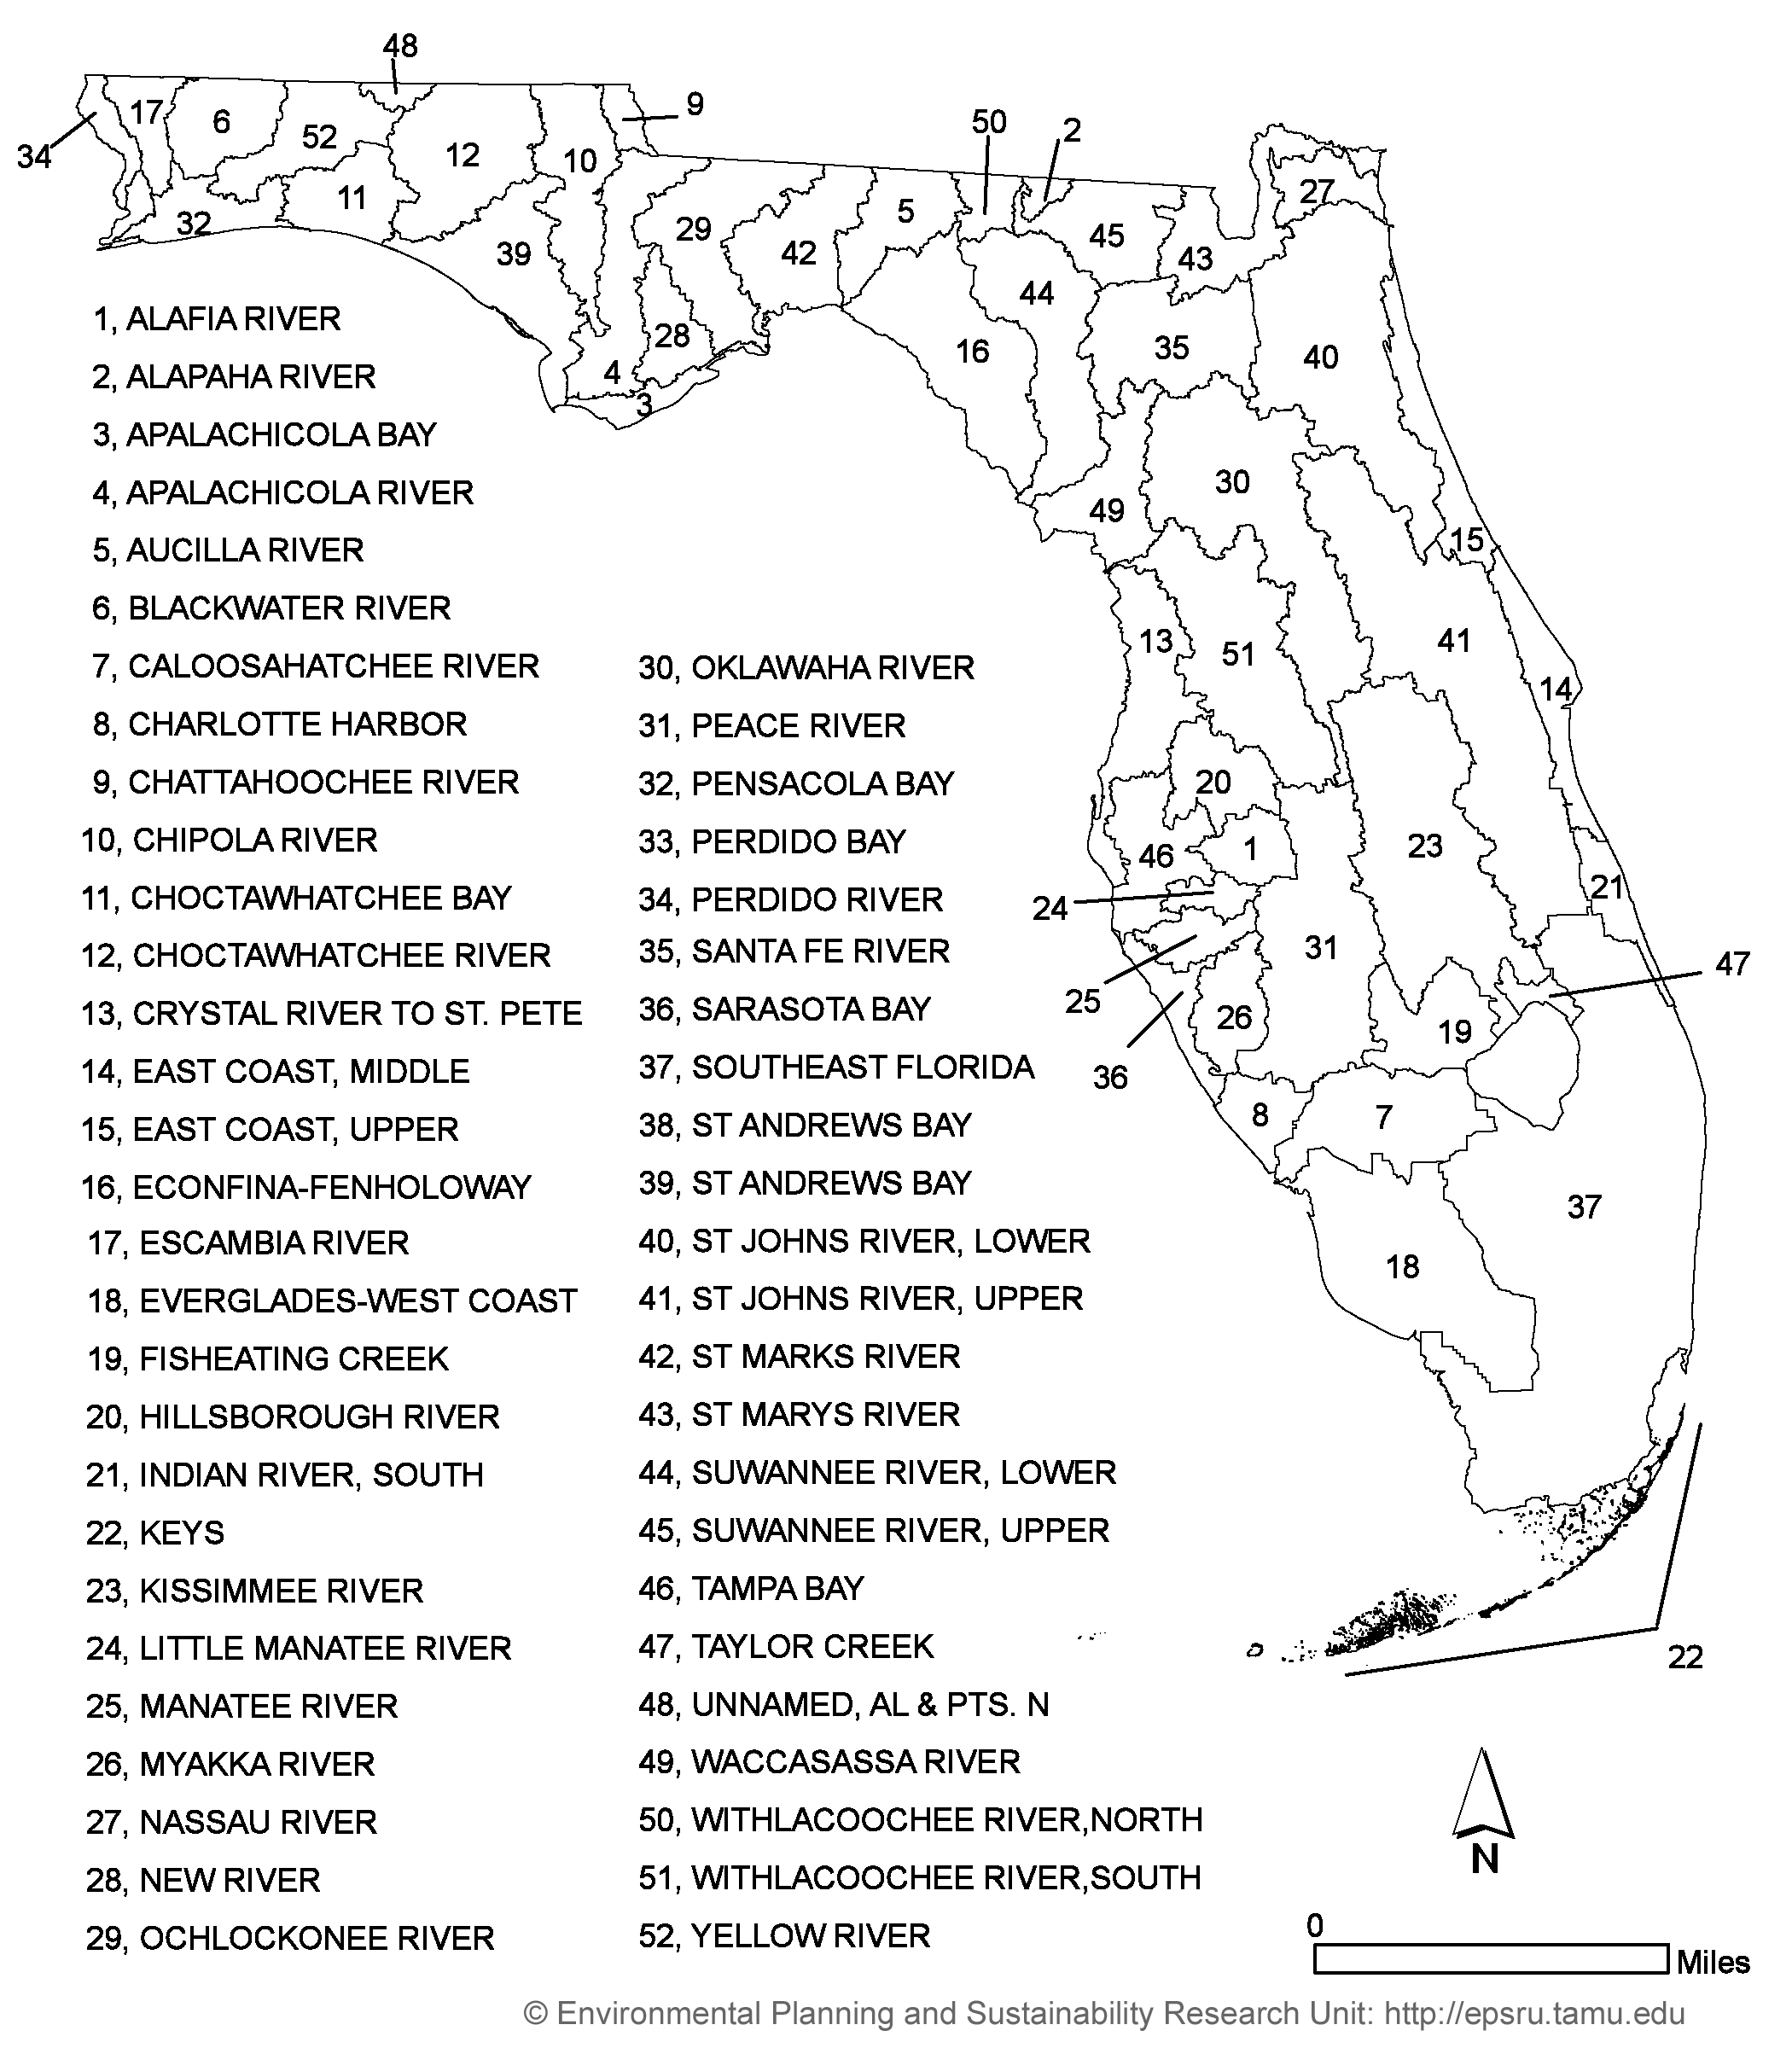
Figure 1. South Florida Hydrologic Unit Codes
(HUCs) included in sample. Published by Brody, Carrasco, & Highfield
(2003) in Environmental Management 32 (6): 661-681. |
 |
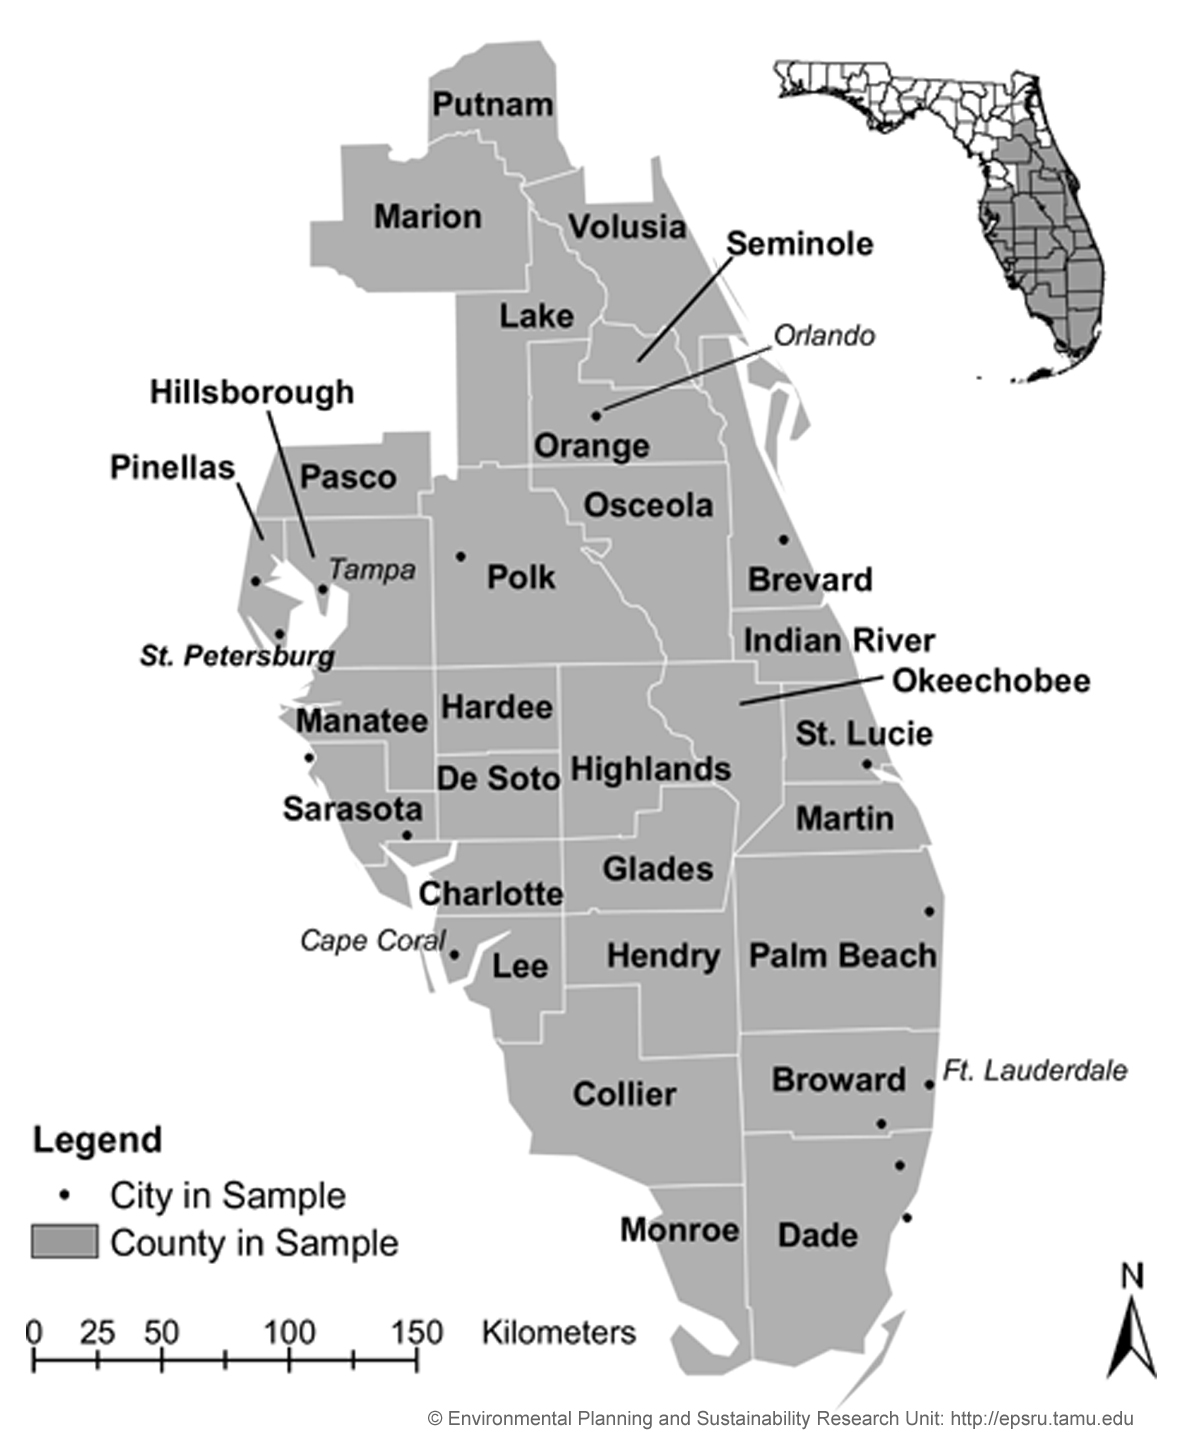
Figure 2. Florida cities and counties included
in sample. Published by Brody, Carrasco, & Highfield (2003) in Environmental
Management 32 (6): 661-681. |
 |
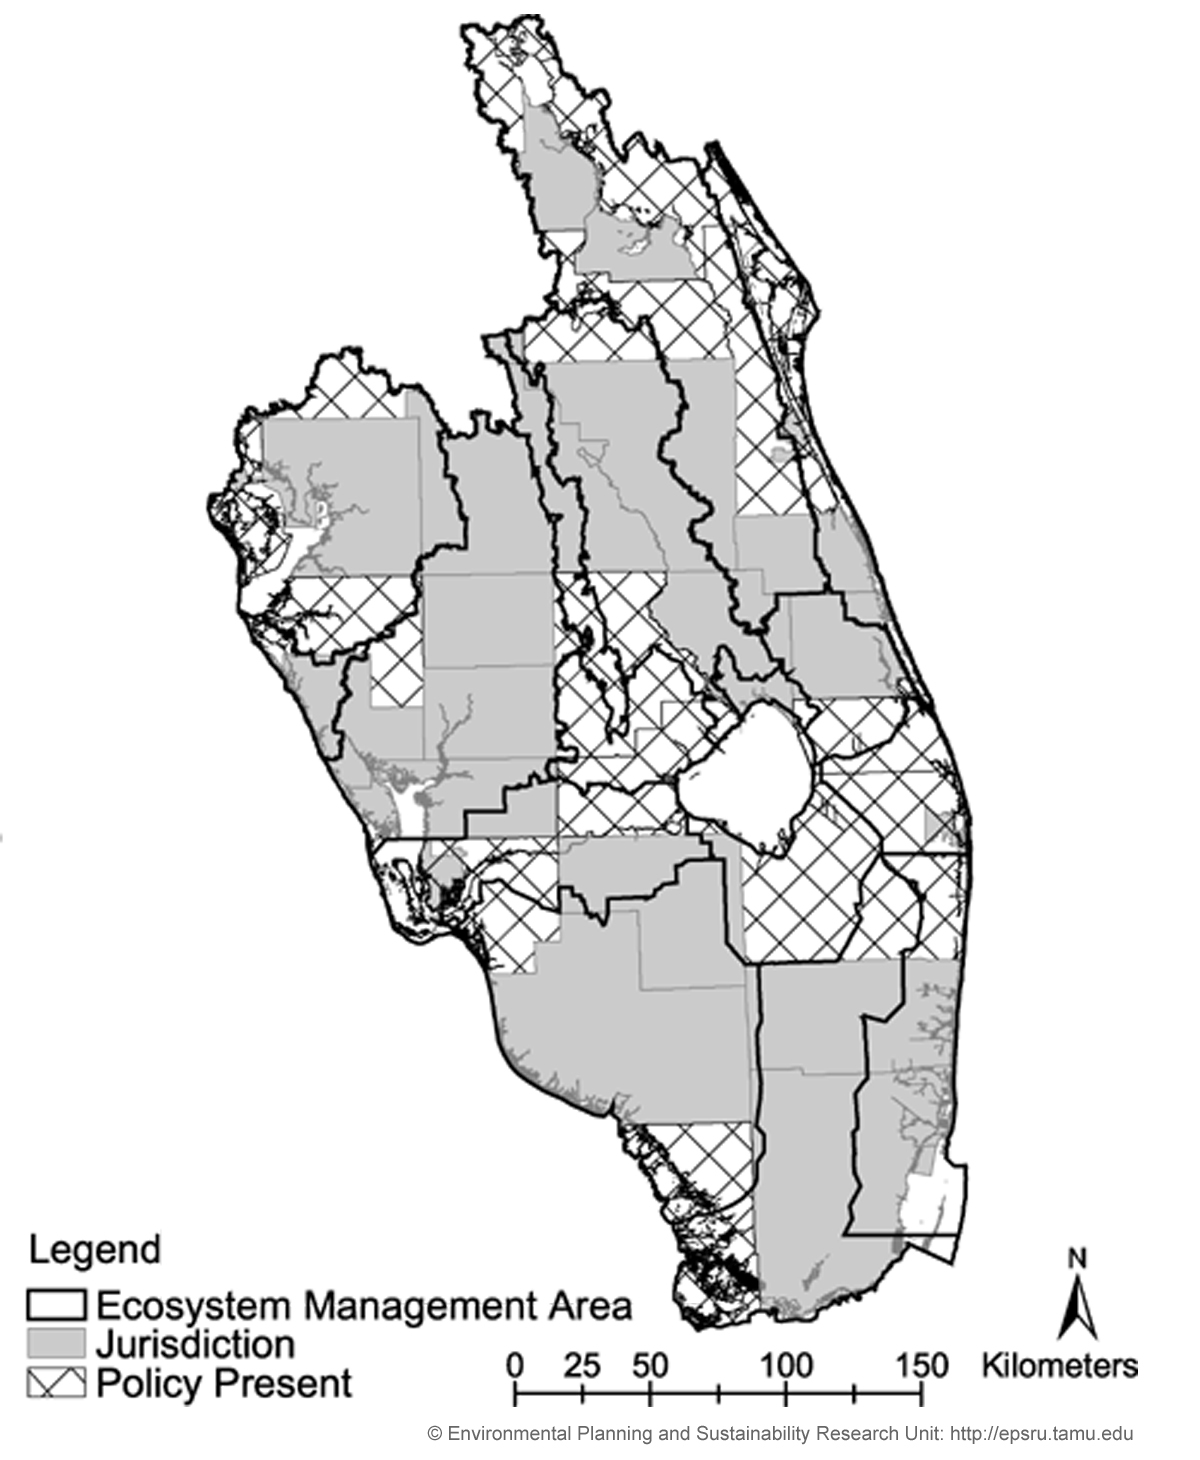
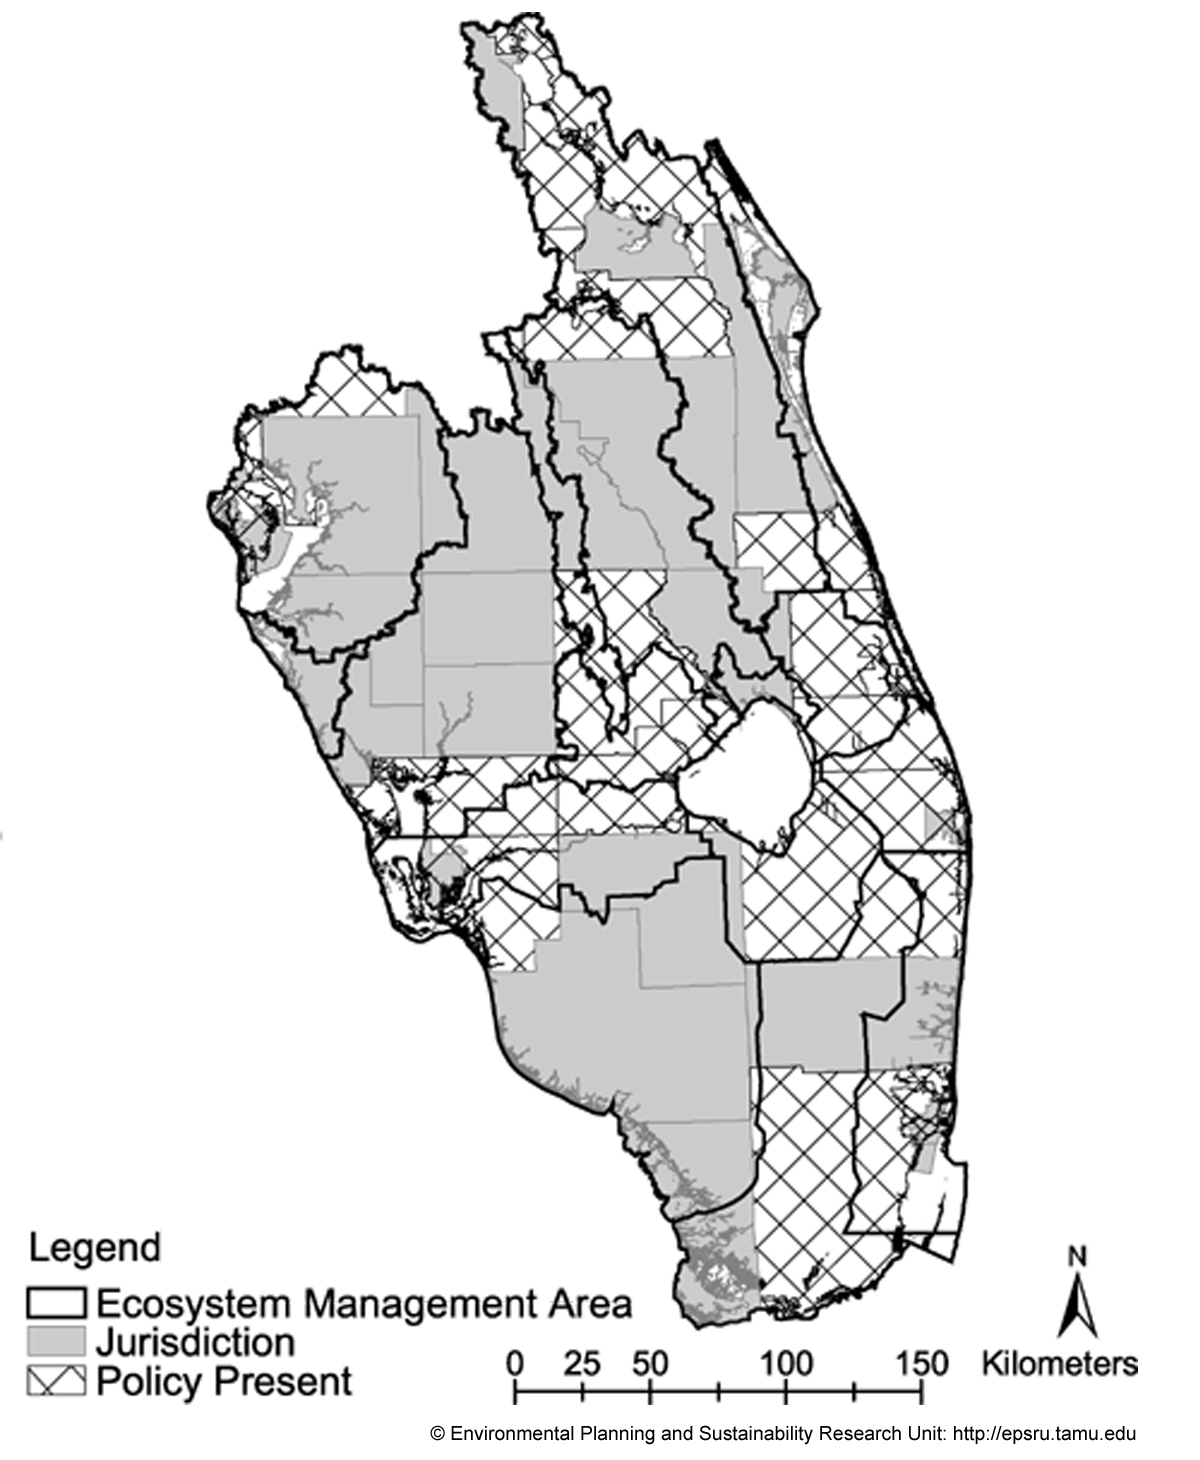
Figure 3. Distribution of policies for actions
to protect natural resources crossing into adjacent jurisdictions. Published
by Brody, Carrasco, & Highfield (2003) in Environmental Management
32 (6): 661-681. |
 |
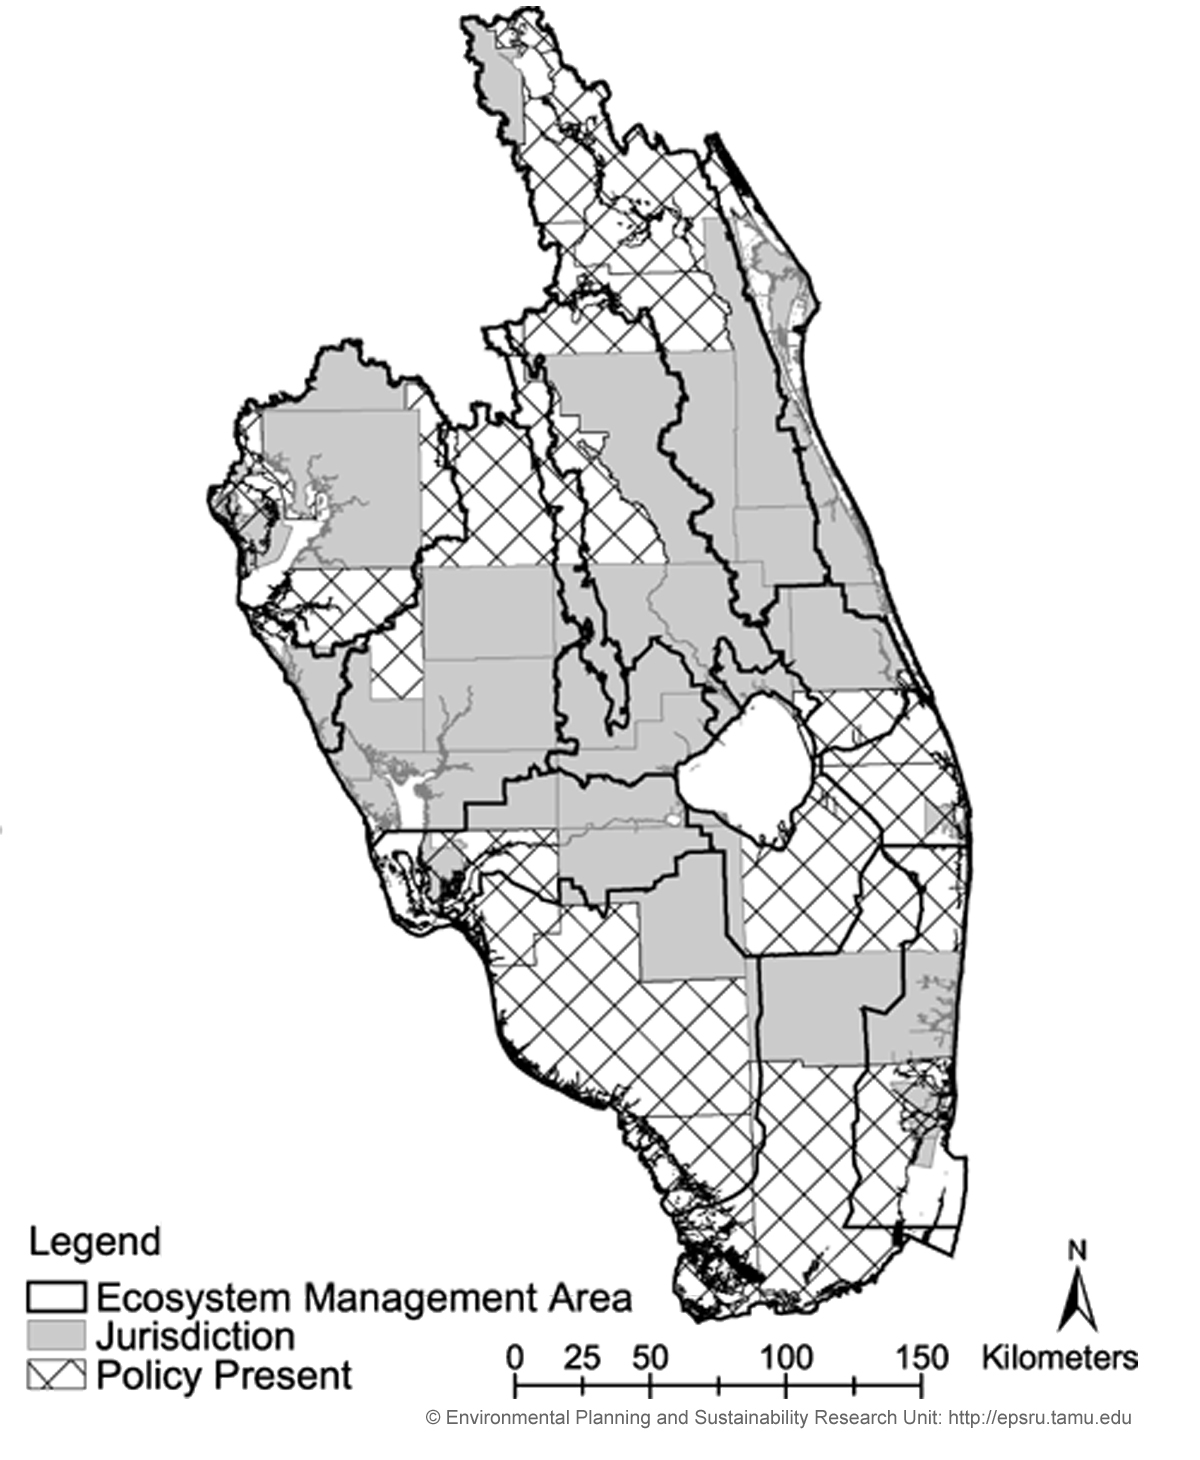
Figure 4. Distribution of strategies for information
sharing. Published by Brody, Carrasco, & Highfield (2003) in Environmental
Management 32 (6): 661-681. |
 |
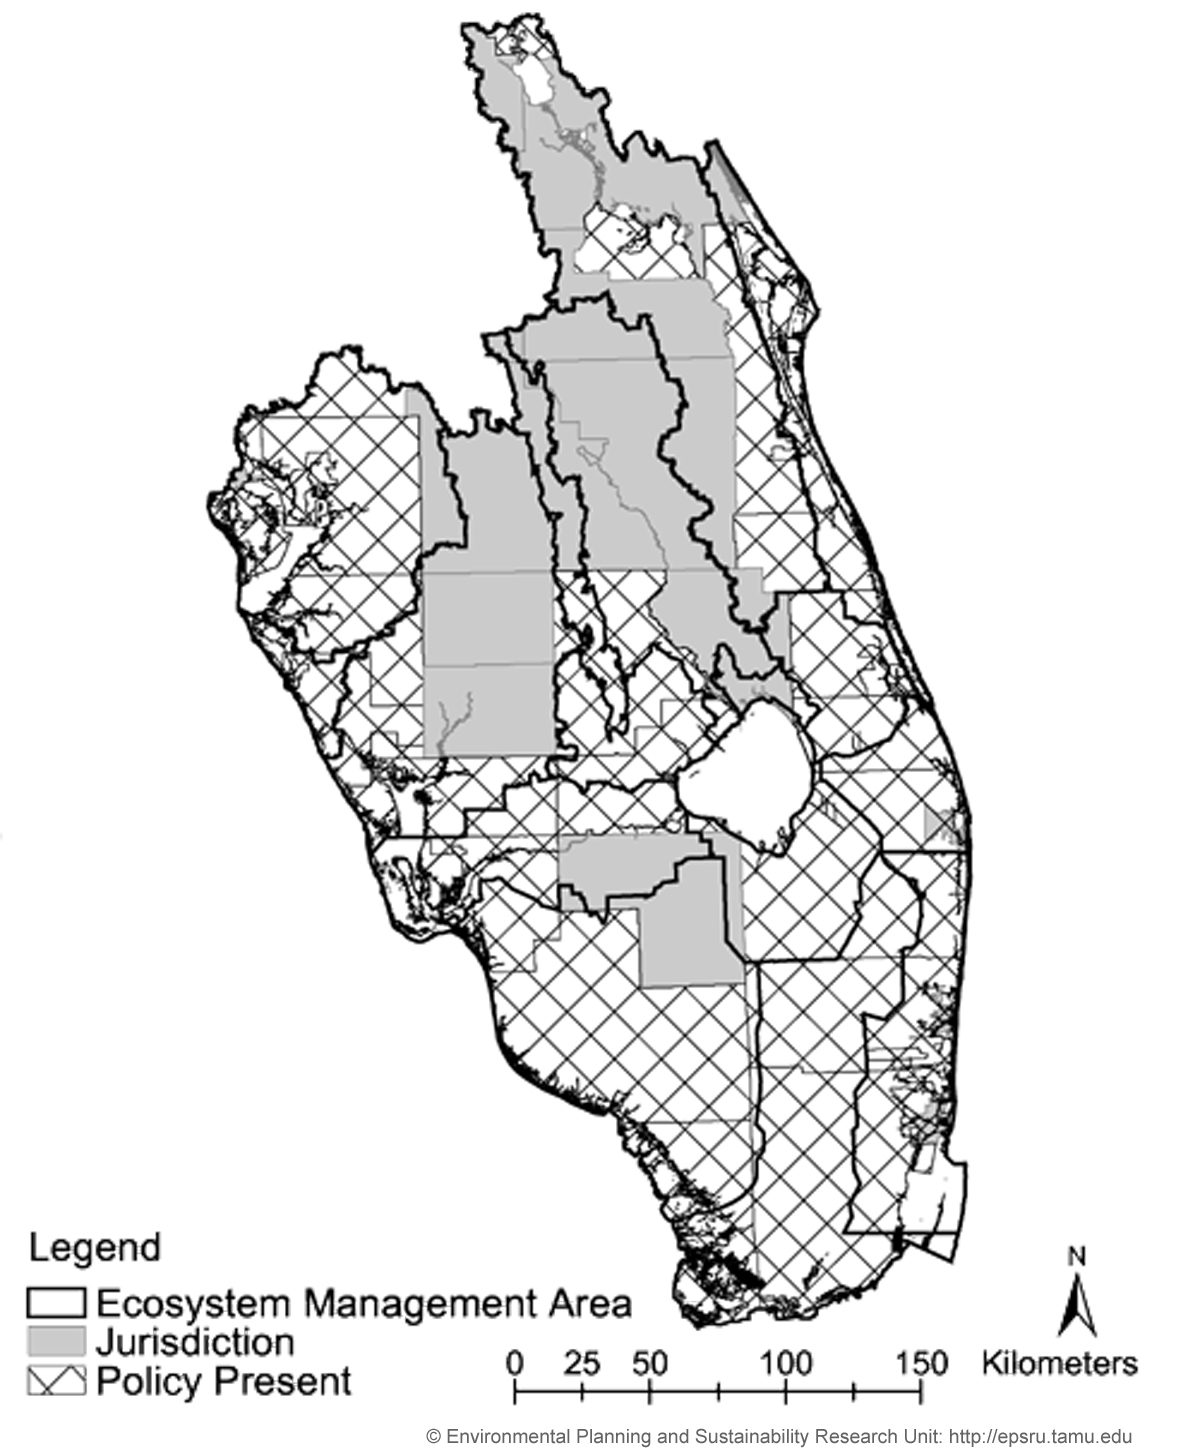
Figure 5. Distribution of policies to maintain
or create wildlife corridors. Published by Brody, Carrasco, & Highfield
(2003) in Environmental Management 32 (6): 661-681. |
 |
Figure 6. Distribution of policies to control
or remove exotic species. Published by Brody, Carrasco, & Highfield
(2003) in Environmental Management 32 (6): 661-681. |
 |
Figure 7. Total ecosystem management scores.
Published by Brody, Carrasco, & Highfield (2003) in Environmental
Management 32 (6): 661-681. |
 |
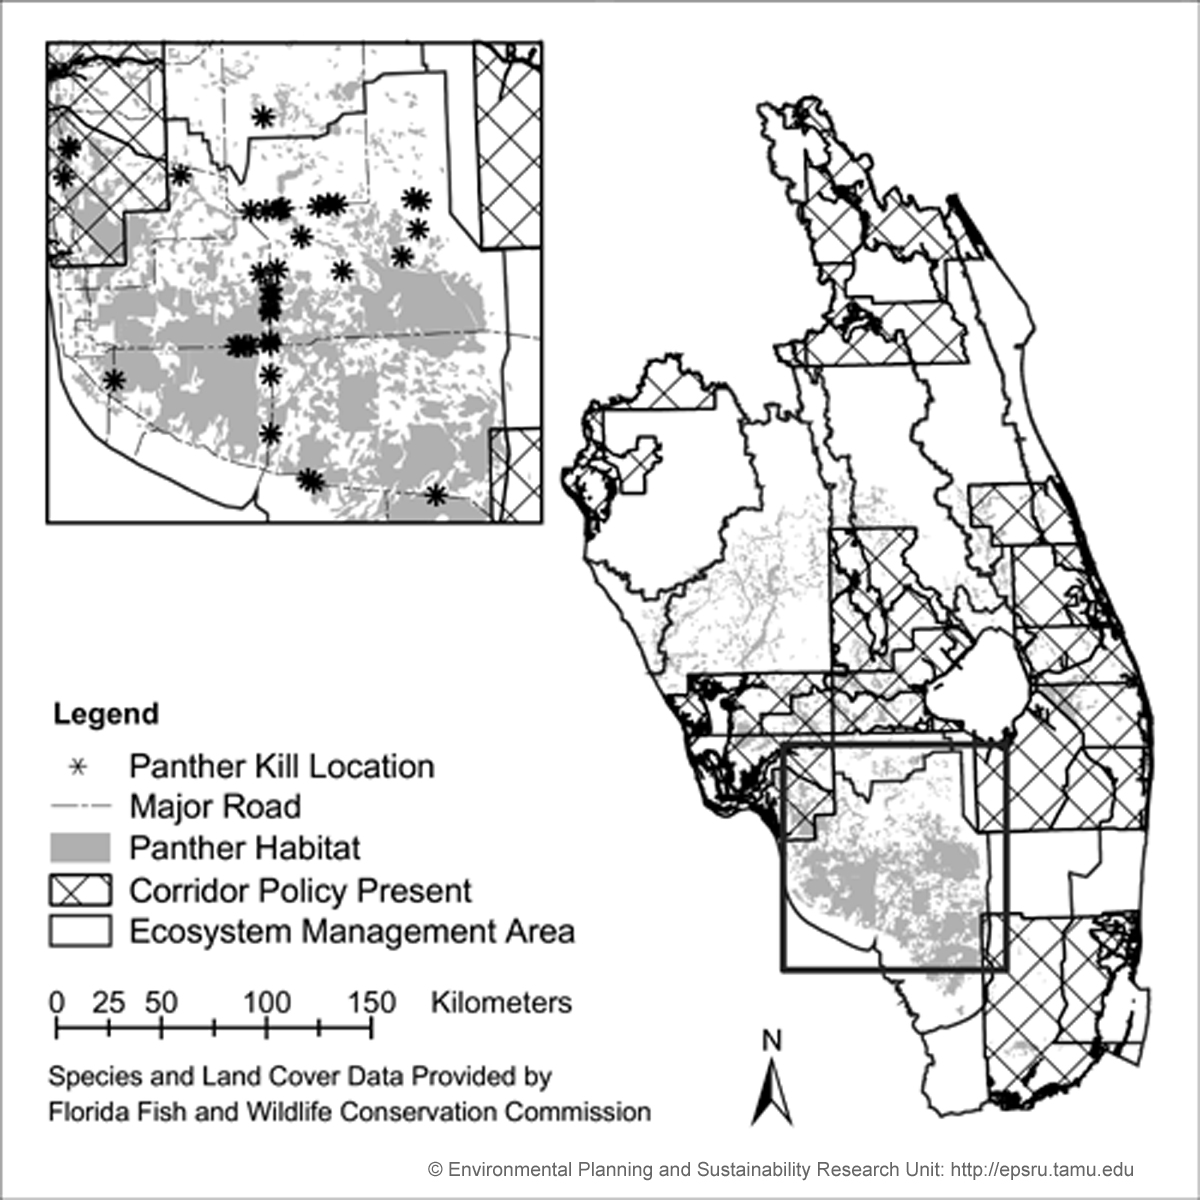
Figure 8. Distribution of panther kill locations,
panther habitat, major roads, and policies to maintain or create wildlife
corridors. Published by Brody, Carrasco, & Highfield (2003) in Environmental
Management 32 (6): 661-681. |
• Other Maps from Various Florida Research Paper
Mapping Environmental Perceptions in Texas,
in partnership with the Institute of Science, Technology and Public Policy
• Does Location Matter? Measuring Environmental
Perceptions of Creeks in Two San Antonio Watersheds. Brody, S.D., Highfield,
W. & Alston, L. (2004). Environment and Behavior 36(2): 229-250.
 |
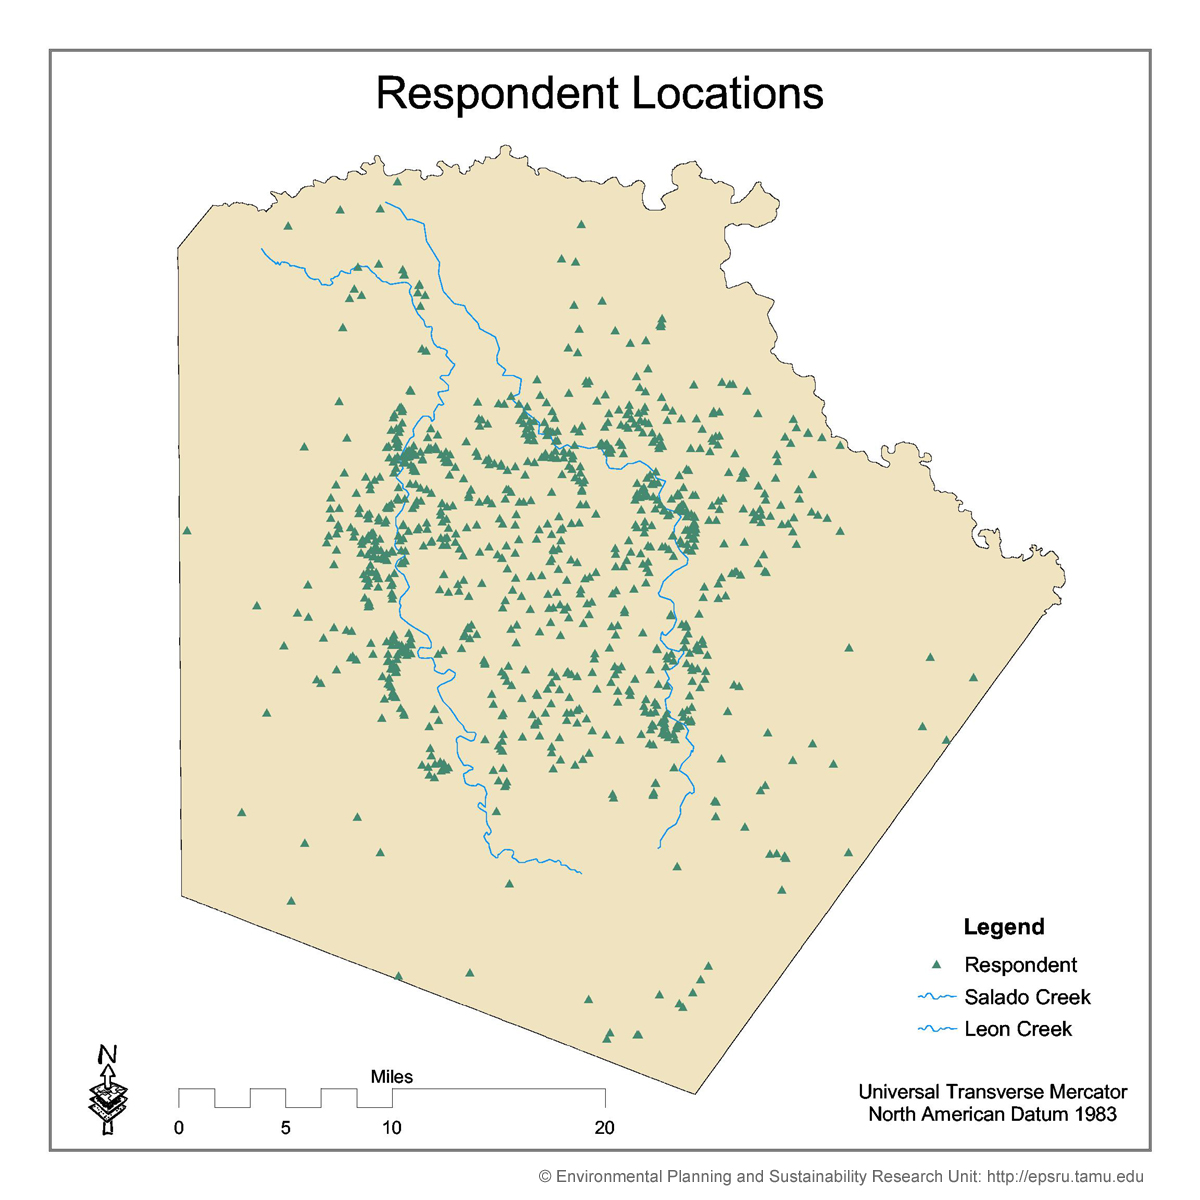
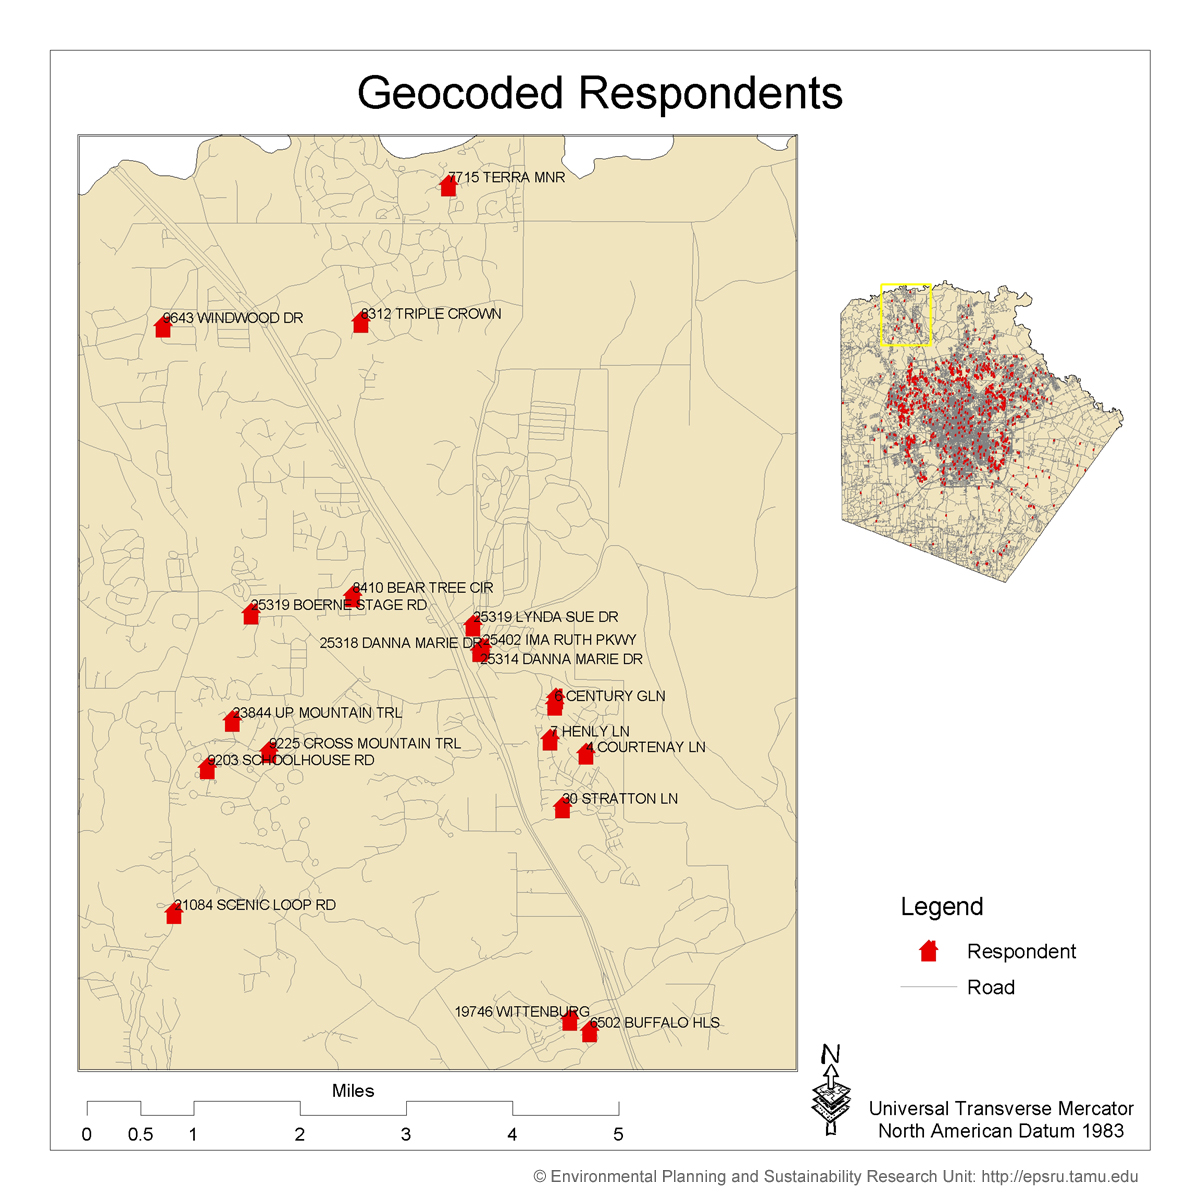
Respondent Locations. Geocoded locations of survey respondents
in Bexar County, Texas. Map created by Wes Highfield, EPSL. Base map layers
from U.S. Census TIGER line file. |
 |
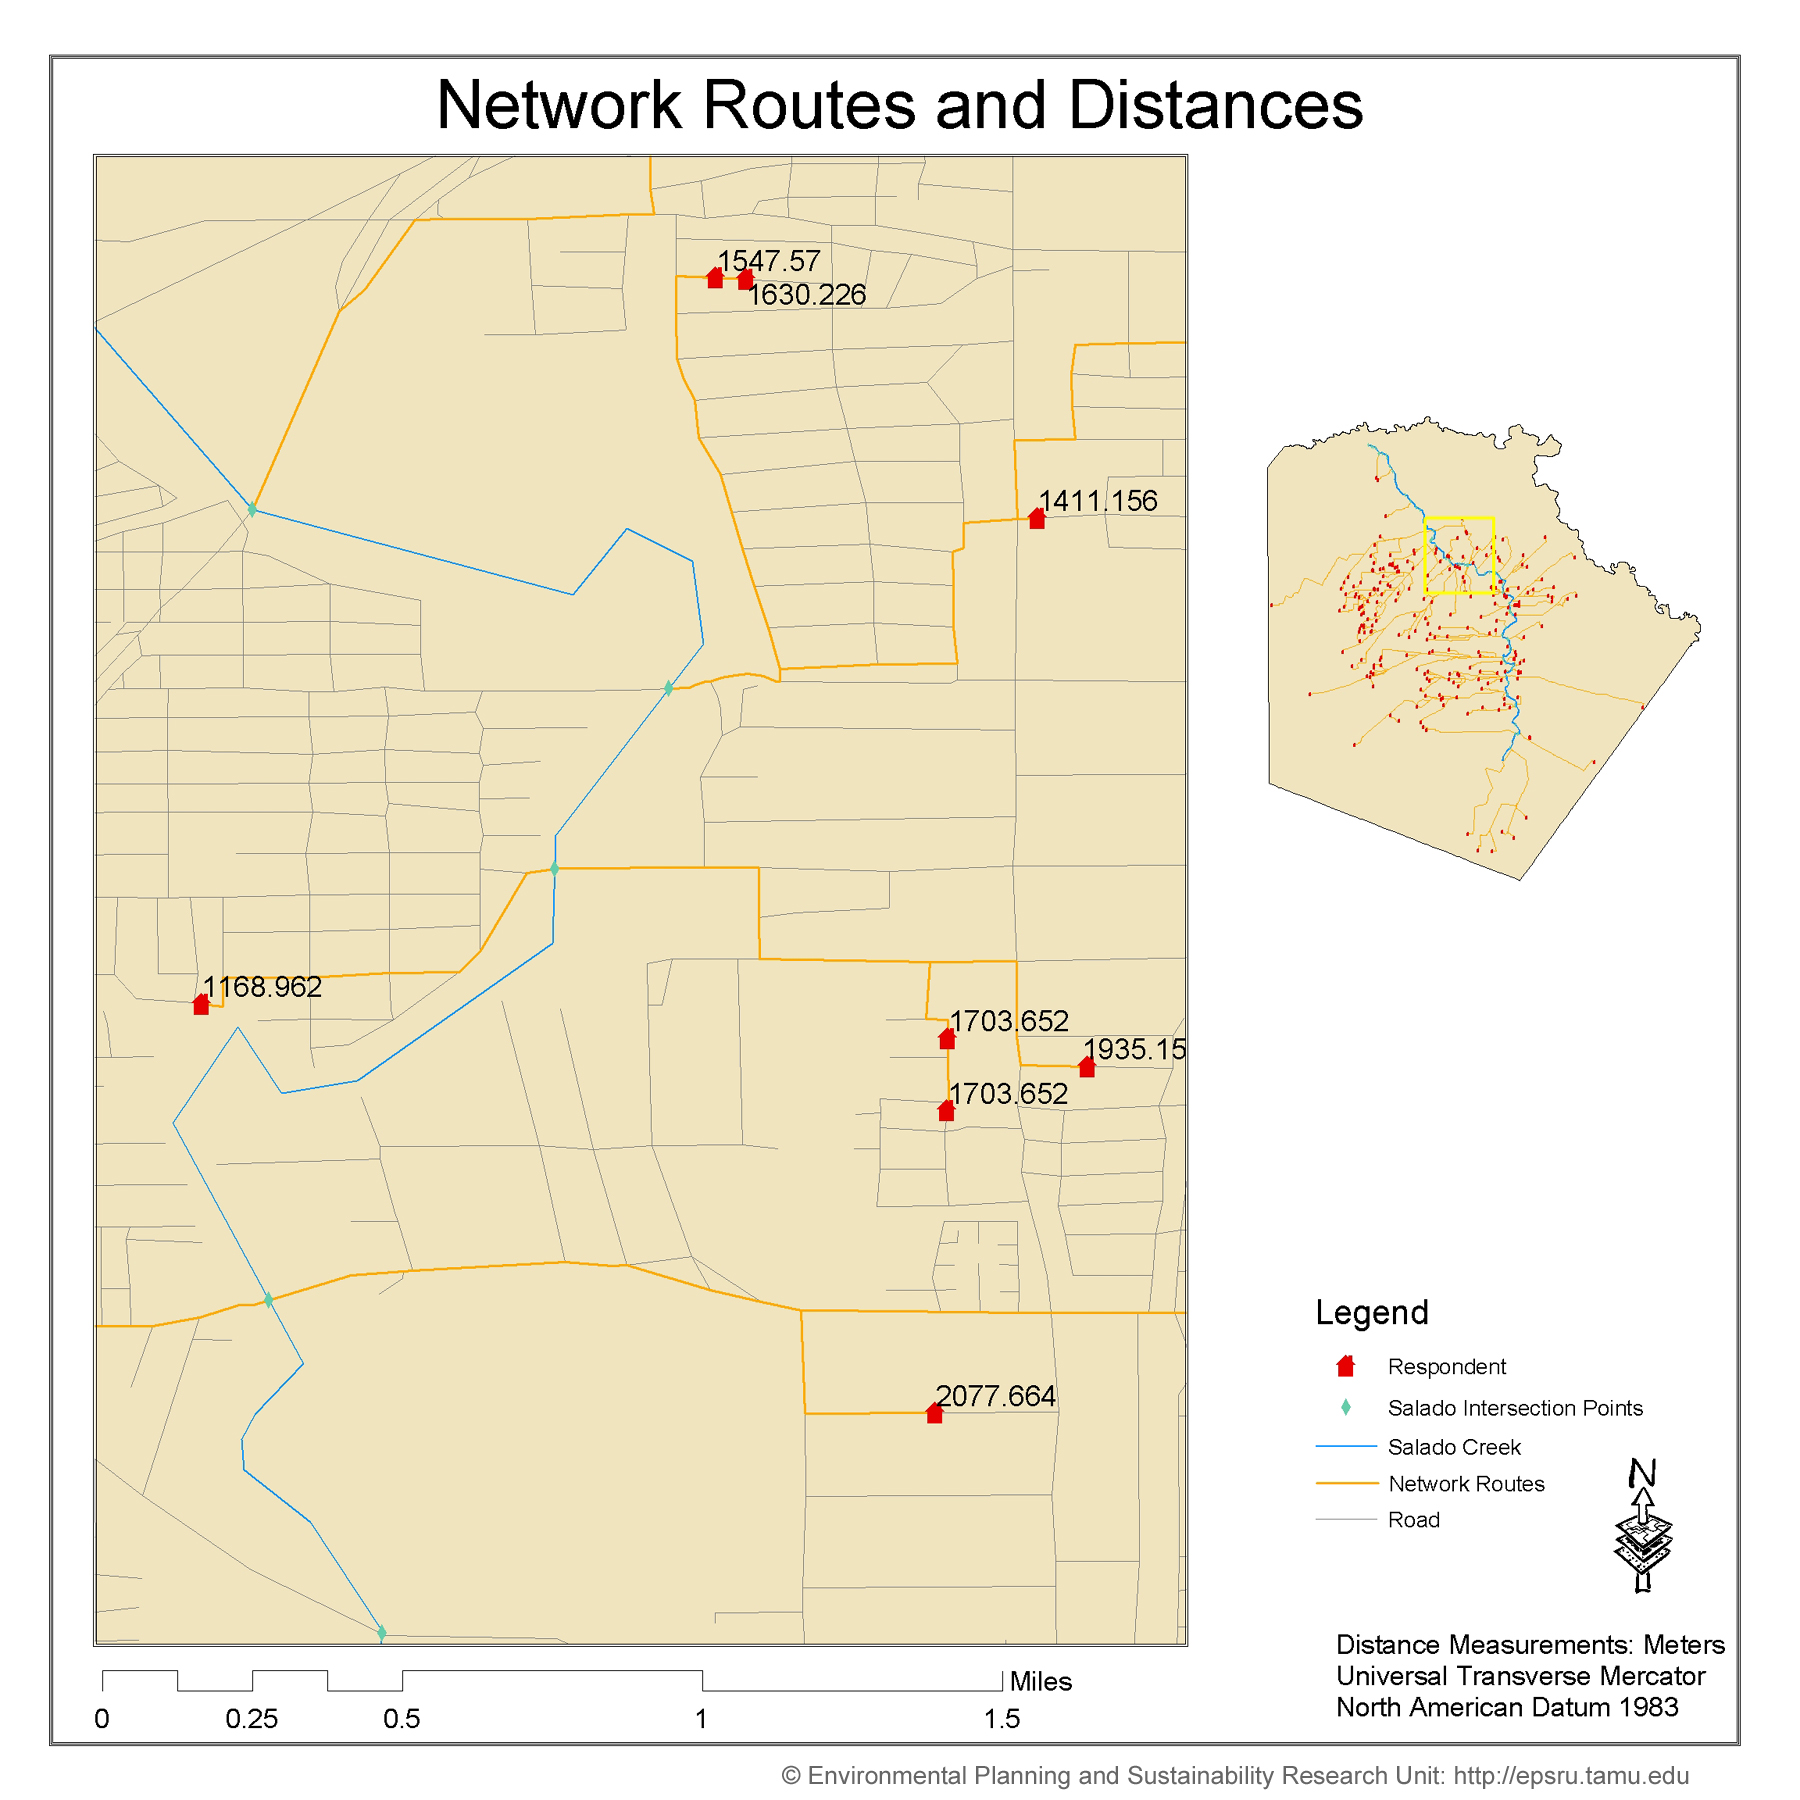
Network Routes and Distances. Closest distance
from a survey respondent’s home following surface roads to Salado
Creek, San Antonio, Texas. Map created by Wes Highfield, EPSL. Base map
layers from U.S. Census TIGER line file. |
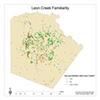 |
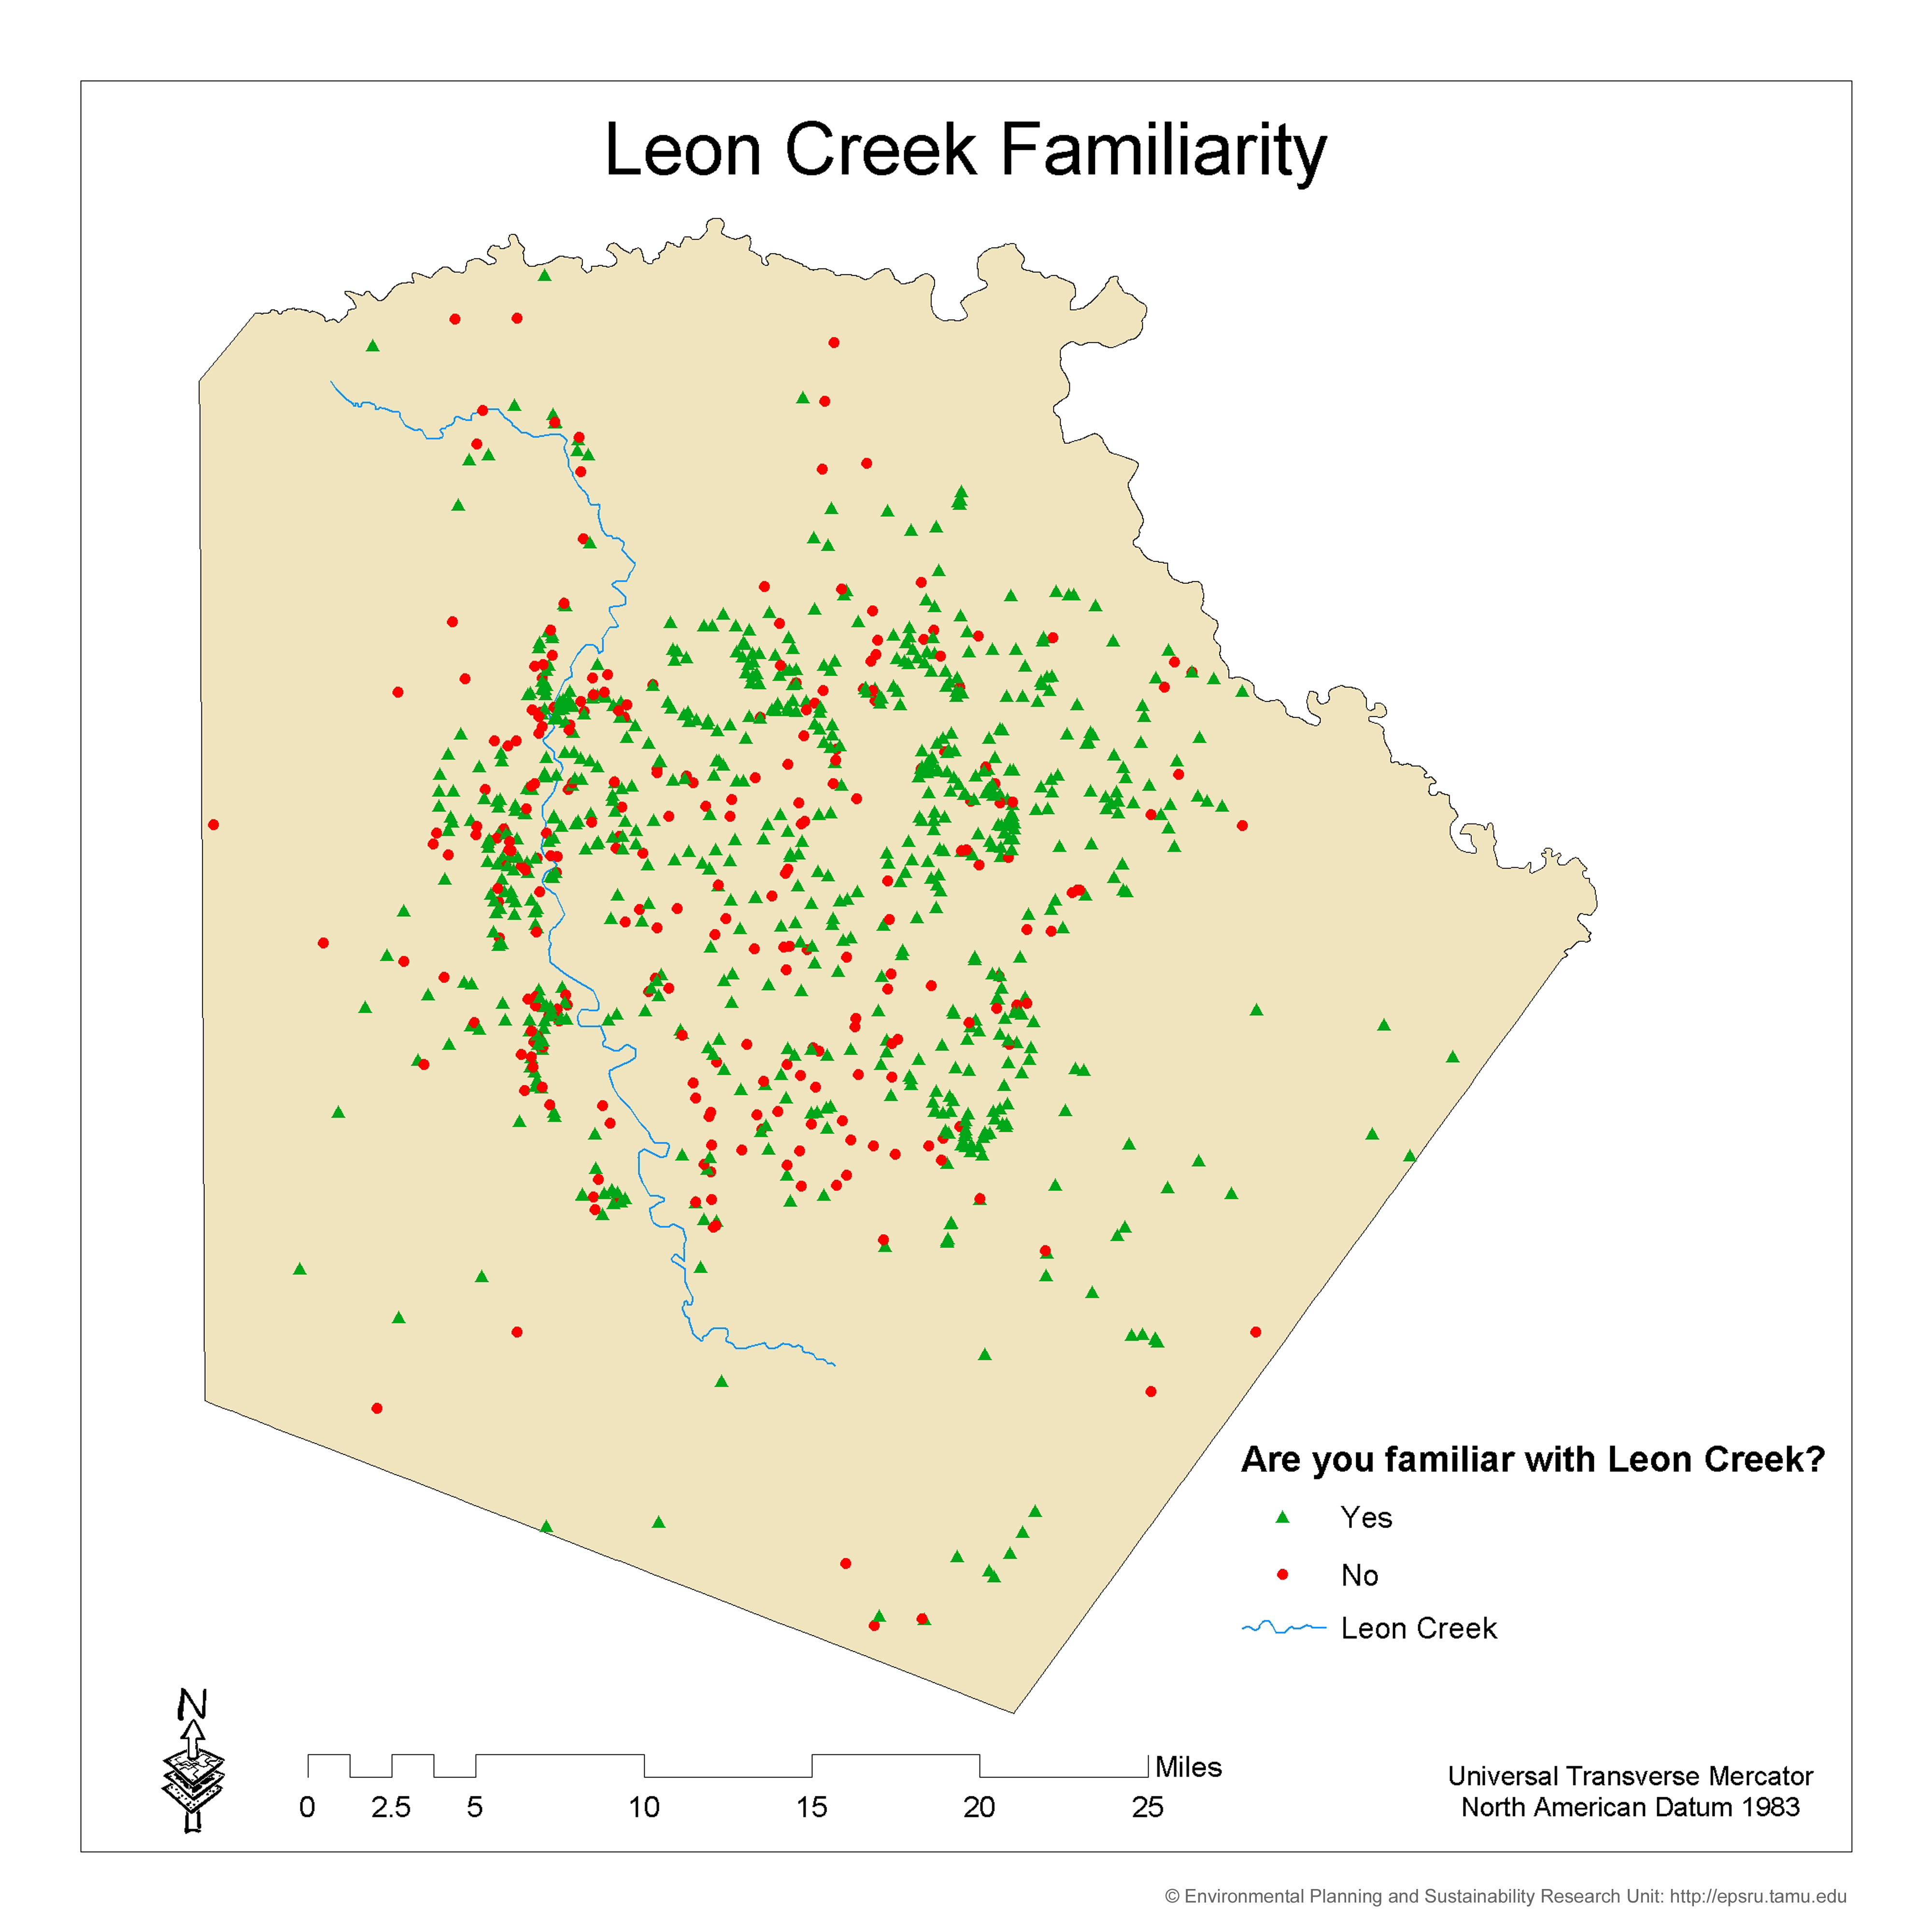
Leon Creek Familiarity. Spatial location of
respondent’s familiarity of Leon Creek, San Antonio, Texas. Map created
by Wes Highfield, EPSL. Base map layers from U.S. Census TIGER line file. |
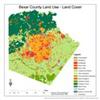 |
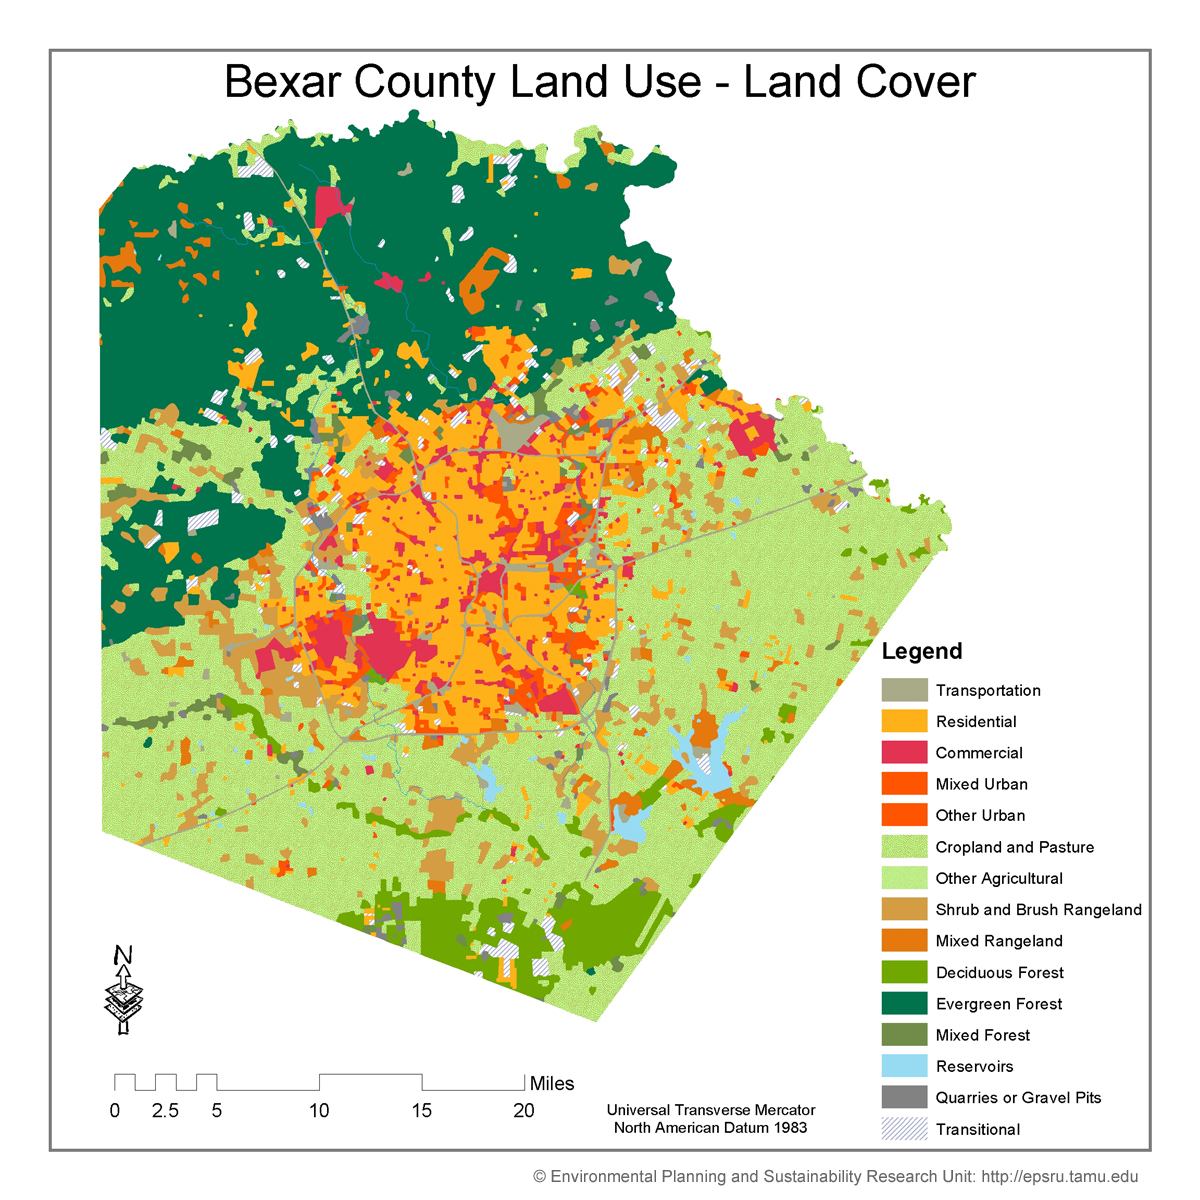
Bexar County Land Use – Land Cover, Texas.
Map created by Wes Highfield, EPSL. Base map layers from USGS NLCD. |
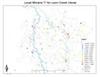 |
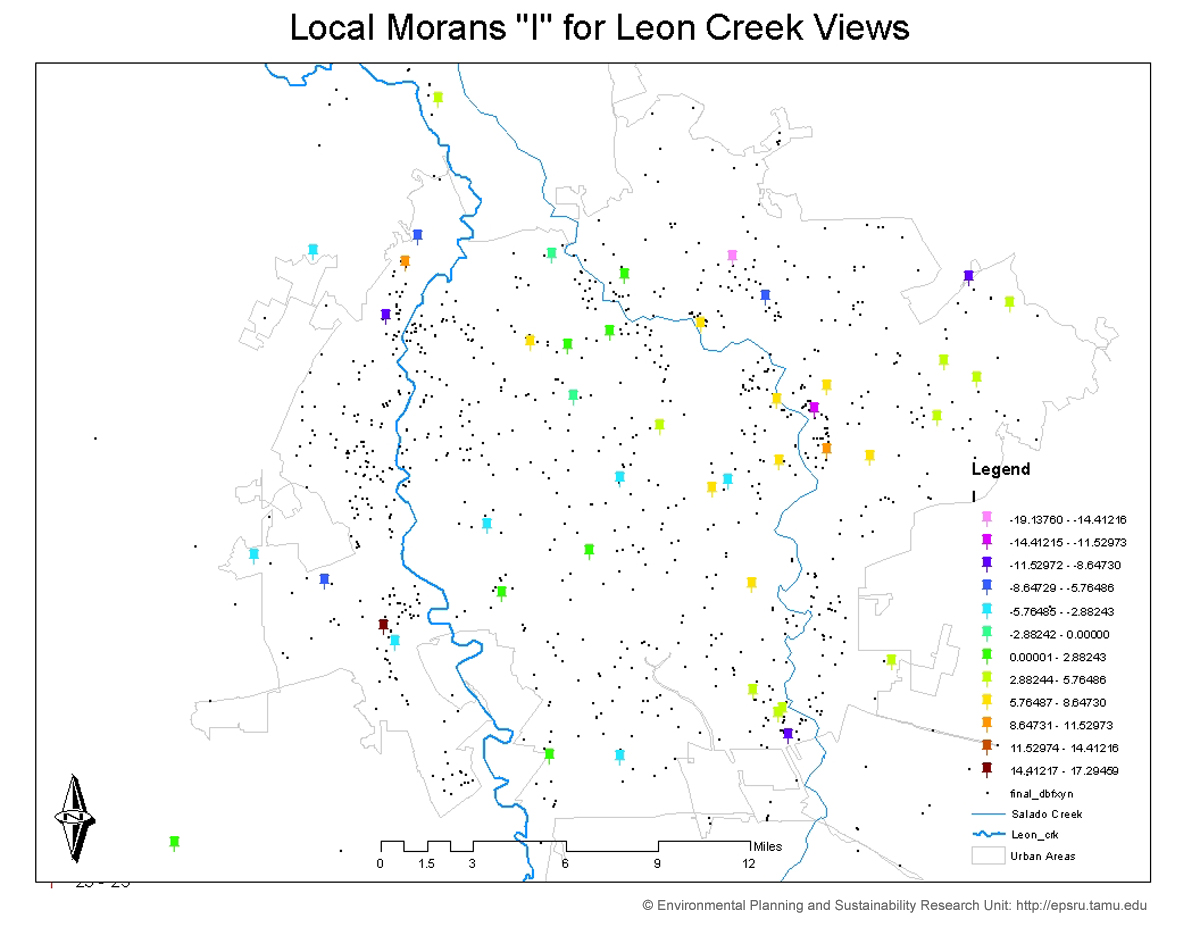
Local Moran’s “I” for Leon Creek
Views, Bexar County, Texas. Map created by Wes Highfield, EPSL. Base map
layers from U.S. Census TIGER line file. |
 |
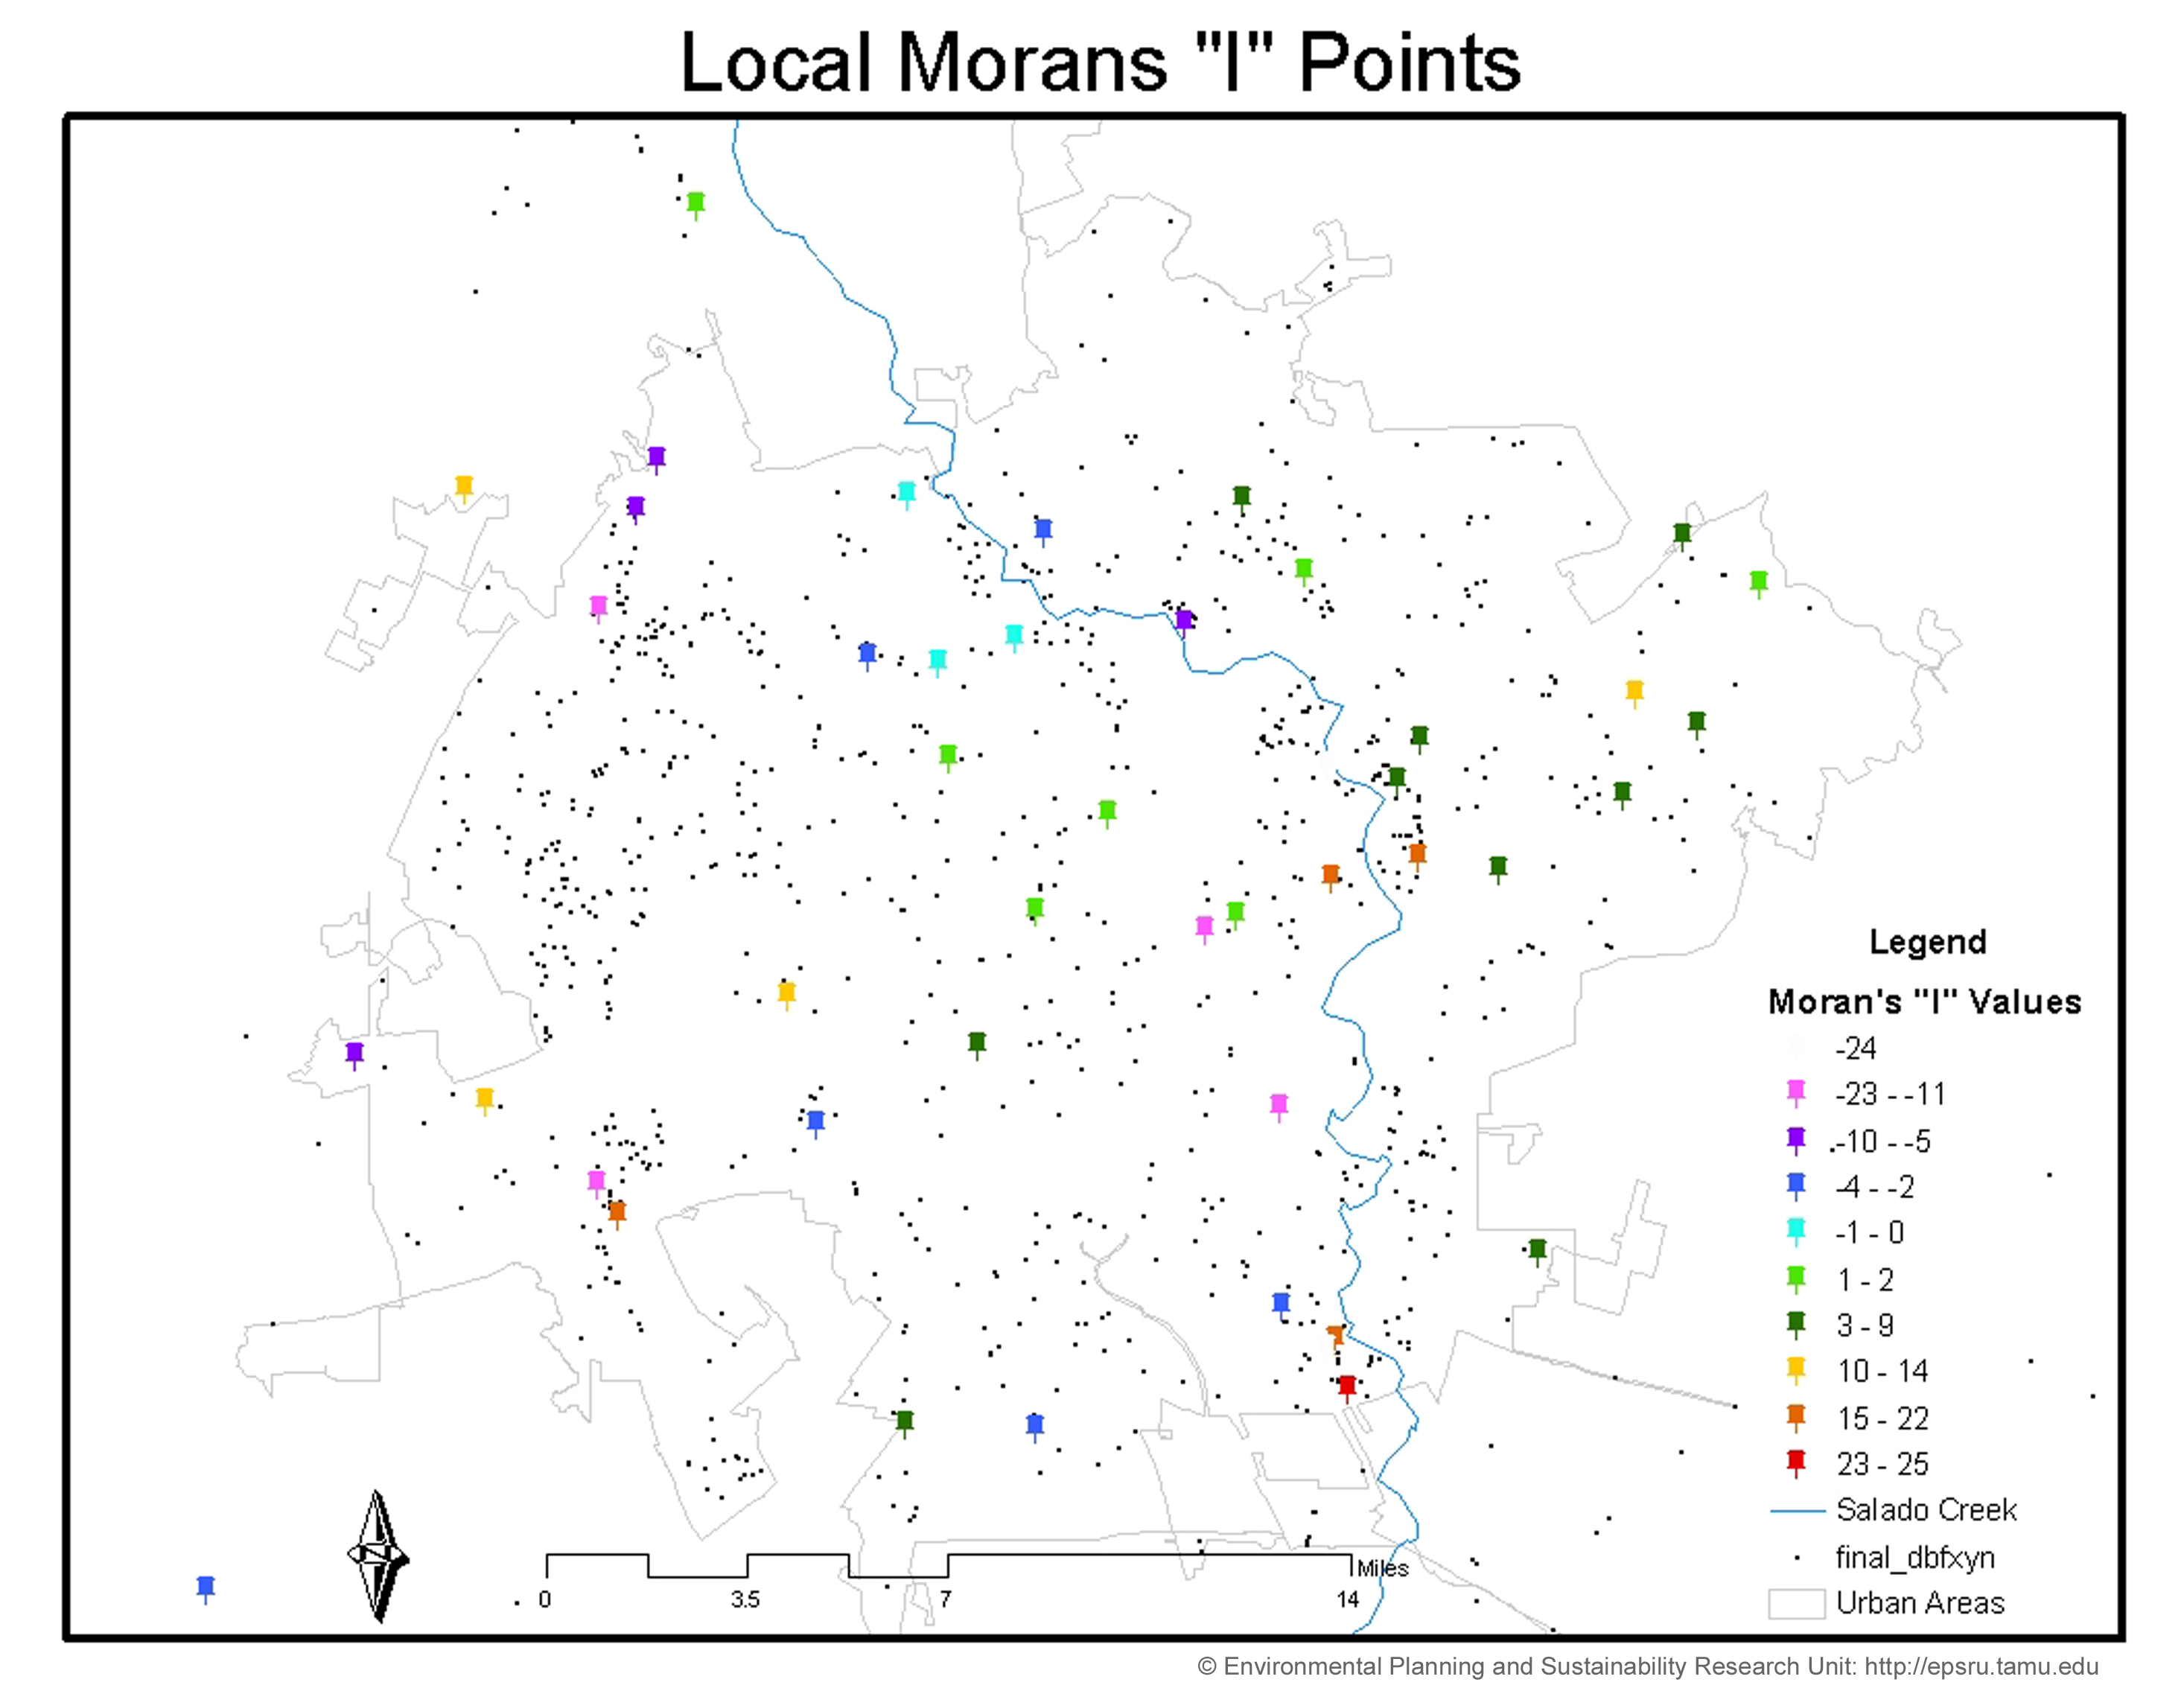
Local Moran’s “I” Points. Local
Moran’s “I” for Salado Creek Views, Bexar County, Texas.
Map created by Wes Highfield, EPSL. Base map layers from U.S. Census TIGER
line file. |
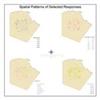 |
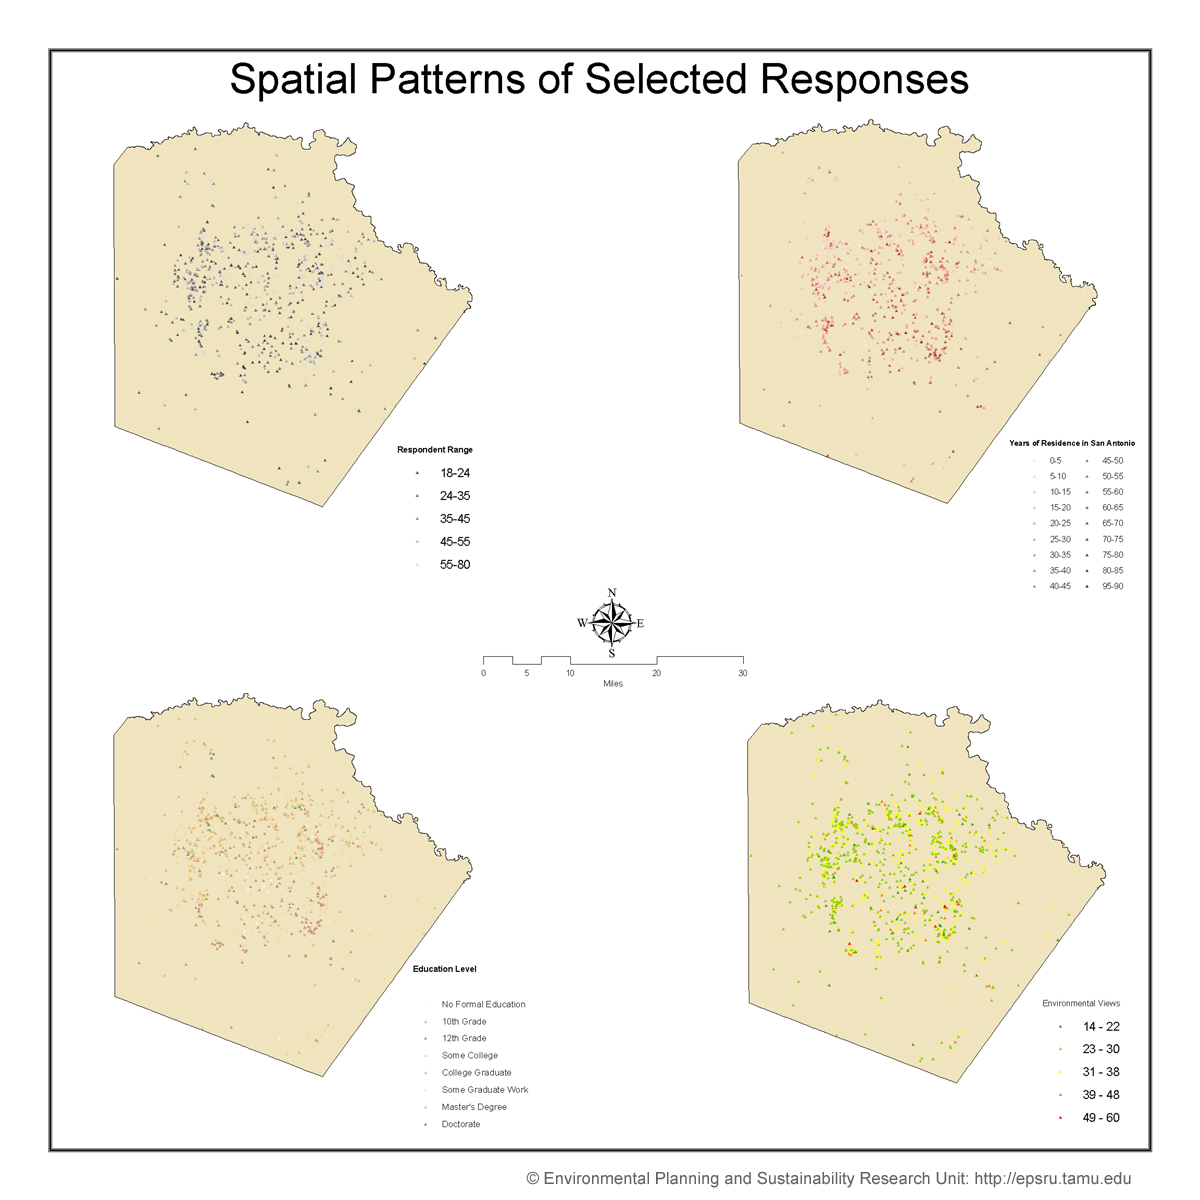
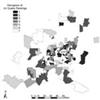
Spatial patterns of selected responses. Map
created by Wes Highfield, EPSL. Base map layers from U.S. Census TIGER line
file. |
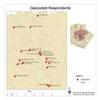 |
Geocoded respondents in Bexar County, Texas.
Map created by Wes Highfield, EPSL. Base map layers from U.S. Census TIGER
line file. |
• Air quality perceptions in Dallas and Houston, Texas.
Brody, S.D., Peck, M. & Highfield, W. (2004). Examining Localized Patterns
of Air Quality Perceptions in Texas: A Spatial and Statistical Analysis. Risk
Analysis 24(6): 1561-1574.
 |
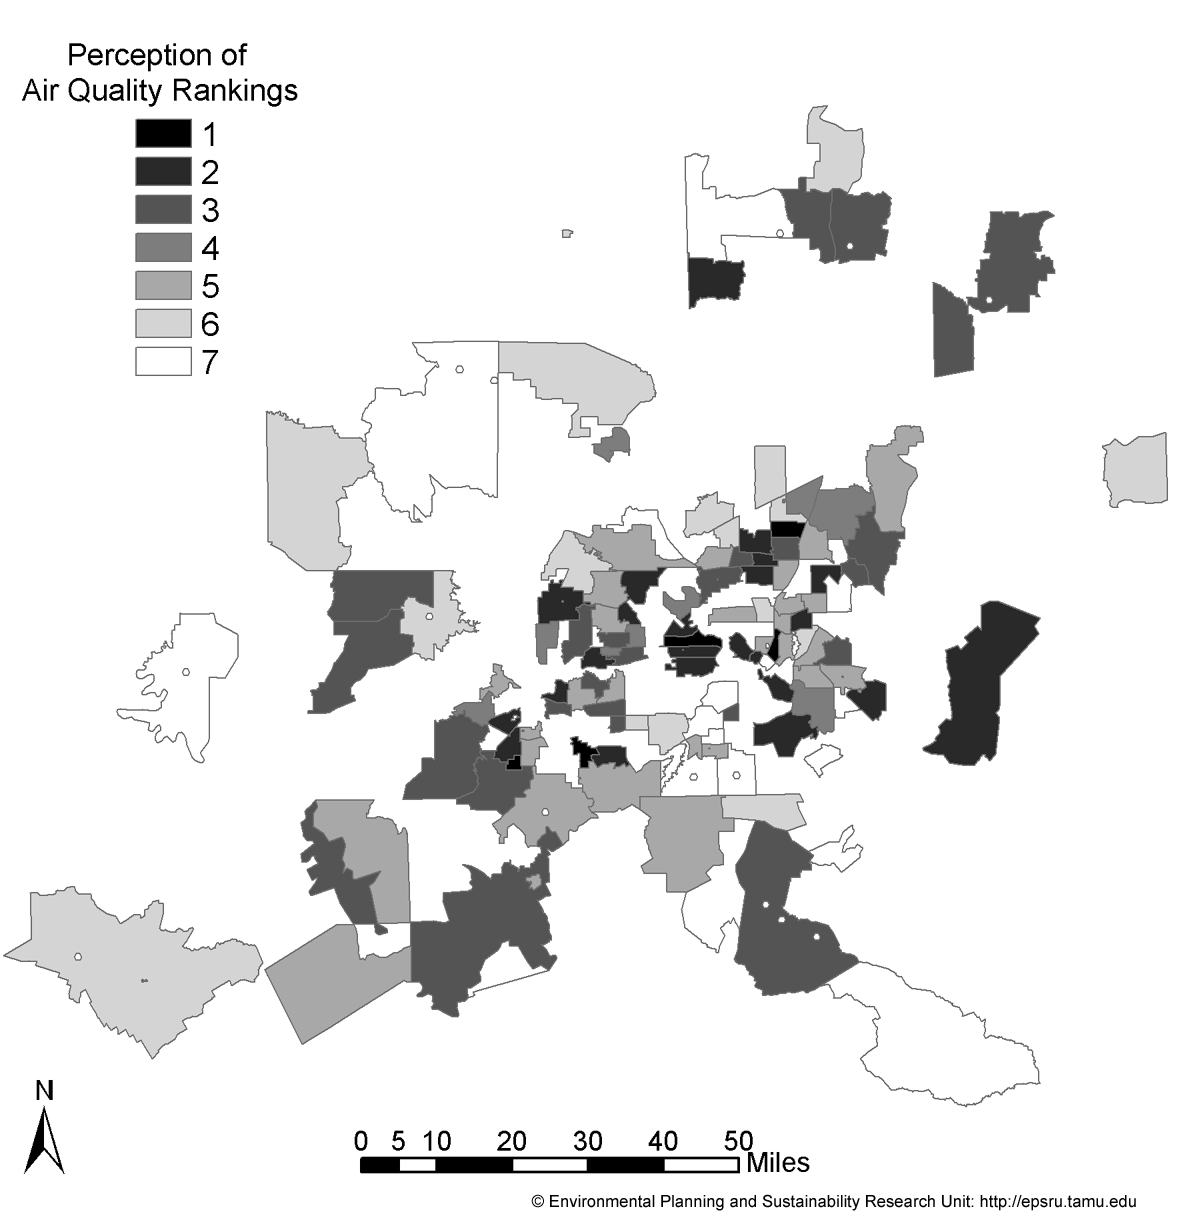
Houston Perception of Air Quality Rankings |
 |
Dallas Perception of Air Quality Rankings |